## Bar Chart: Rating Distribution by Model
### Overview
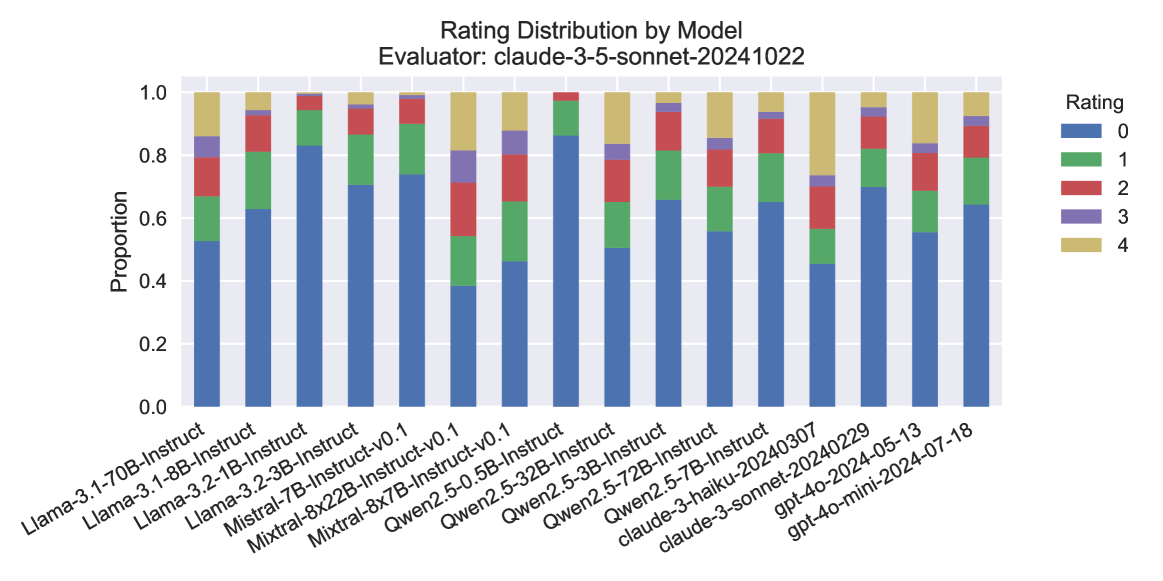
The chart displays the distribution of ratings (0-4) across multiple AI models evaluated by "claude-3-5-sonnet-20241022". Each bar represents a model, with stacked segments showing the proportion of ratings received. The y-axis measures proportion (0.0 to 1.0), while the x-axis lists model names.
### Components/Axes
- **X-axis (Models)**:
- Llama-3-1-70B-Instruct
- Llama-3-1-8B-Instruct
- Llama-3-2-3B-Instruct
- Llama-3-2-8B-Instruct
- Mistral-7B-Instruct-v0.1
- Mistral-8x7B-Instruct-v0.1
- Qwen2-5-5B-Instruct
- Qwen2-5-72B-Instruct
- Claude-3-haiku-20240307
- Claude-3-sonnet-20240229
- GPT-40-mini-2024-05-13
- GPT-40-mini-2024-07-18
- **Y-axis (Proportion)**:
- Scale: 0.0 to 1.0 in increments of 0.2
- Labels: "Proportion"
- **Legend (Right)**:
- **Blue**: Rating 0
- **Green**: Rating 1
- **Red**: Rating 2
- **Purple**: Rating 3
- **Yellow**: Rating 4
### Detailed Analysis
- **Rating 0 (Blue)**:
- Dominates most bars (e.g., Llama-3-1-70B-Instruct: ~0.5, Mistral-7B-Instruct-v0.1: ~0.75).
- Claude-3-sonnet-20240229 has the lowest proportion (~0.45).
- **Rating 1 (Green)**:
- Significant in Mistral-7B-Instruct-v0.1 (~0.2) and Claude-3-haiku-20240307 (~0.15).
- Minimal in Qwen2-5-5B-Instruct (~0.05).
- **Rating 2 (Red)**:
- Notable in Llama-3-1-8B-Instruct (~0.15) and Qwen2-5-72B-Instruct (~0.1).
- Absent in Mistral-8x7B-Instruct-v0.1.
- **Rating 3 (Purple)**:
- Small segments in Llama-3-1-70B-Instruct (~0.05) and Qwen2-5-72B-Instruct (~0.05).
- None in Mistral-8x7B-Instruct-v0.1.
- **Rating 4 (Yellow)**:
- Consistently minimal across all models (~0.05-0.1).
- Highest in Qwen2-5-72B-Instruct (~0.1).
### Key Observations
1. **Rating 0 Dominance**: Most models receive the lowest rating, suggesting widespread underperformance or strict evaluation criteria.
2. **Variability in Rating 1**: Mistral and Claude models show moderate proportions of this rating, indicating mixed performance.
3. **Rare High Ratings**: Ratings 3 and 4 are nearly absent, with only Qwen2-5-72B-Instruct showing slight improvement.
4. **Model-Specific Trends**:
- Llama-3-1-70B-Instruct has the highest proportion of Rating 0 (~0.5).
- GPT-40-mini-2024-07-18 shows the most balanced distribution (Rating 0: ~0.6, Rating 1: ~0.2).
### Interpretation
The data suggests that most evaluated models struggle to meet expectations, with Rating 0 being the most common outcome. The presence of Rating 1 in some models (e.g., Mistral, Claude) indicates partial success, but no model achieves high ratings consistently. The evaluator "claude-3-5-sonnet-20241022" likely applied rigorous criteria, as high ratings (3-4) are rare. The slight improvement in Qwen2-5-72B-Instruct and GPT-40-mini-2024-07-18 may reflect architectural or training advantages.
**Note**: Proportions are approximate due to visual estimation from the chart.