\n
## Stacked Bar Chart: Rating Distribution by Model
### Overview
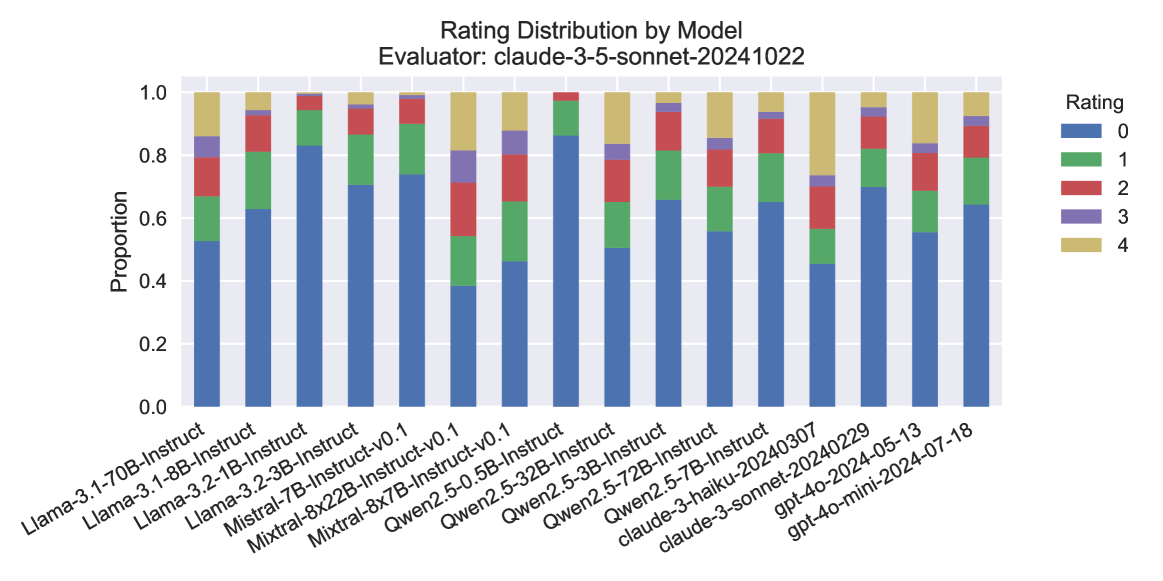
The image presents a stacked bar chart visualizing the distribution of ratings (0 to 4) for various language models. The chart is titled "Rating Distribution by Model" and indicates the evaluator used was "claude-3-sonnet-20241022". The x-axis represents different language models, and the y-axis represents the proportion of ratings. Each bar is segmented to show the proportion of each rating level for that model.
### Components/Axes
* **Title:** Rating Distribution by Model
* **Evaluator:** claude-3-sonnet-20241022
* **X-axis:** Model Name (Categorical)
* Llama-3-70B-Instruct
* Llama-3-8B-Instruct
* Llama-3-2-1B-Instruct
* Llama-3-2-3B-Instruct
* Mistral-7B-Instruct
* Mistral-8x22B-Instruct-v0.1
* Mixtral-8x7B-Instruct-v0.1
* Qwen2-3.5-0.5B-Instruct
* Qwen2-5-32B-Instruct
* Qwen2-5-3B-Instruct
* Qwen2-5-72B-Instruct
* Qwen2-5-7B-Instruct
* claude-3-haiku-20240307
* claude-3-sonnet-202405-13
* gpt-4o-mini-2024-07-18
* **Y-axis:** Proportion (Scale: 0.0 to 1.0)
* **Legend:** Rating (Categorical)
* 0 (Blue)
* 1 (Orange)
* 2 (Green)
* 3 (Red)
* 4 (Purple)
### Detailed Analysis
The chart displays the proportion of each rating for each model. The bars are stacked, meaning the total height of each bar represents the total proportion (which should ideally sum to 1.0, though minor rounding errors may exist).
Here's a breakdown of the approximate proportions for each model, based on visual estimation and color-matching to the legend:
* **Llama-3-70B-Instruct:** ~0.05 (0), ~0.1 (1), ~0.2 (2), ~0.4 (3), ~0.25 (4)
* **Llama-3-8B-Instruct:** ~0.1 (0), ~0.15 (1), ~0.25 (2), ~0.35 (3), ~0.15 (4)
* **Llama-3-2-1B-Instruct:** ~0.2 (0), ~0.2 (1), ~0.25 (2), ~0.25 (3), ~0.1 (4)
* **Llama-3-2-3B-Instruct:** ~0.15 (0), ~0.15 (1), ~0.25 (2), ~0.3 (3), ~0.15 (4)
* **Mistral-7B-Instruct:** ~0.1 (0), ~0.15 (1), ~0.2 (2), ~0.35 (3), ~0.2 (4)
* **Mistral-8x22B-Instruct-v0.1:** ~0.05 (0), ~0.1 (1), ~0.2 (2), ~0.4 (3), ~0.25 (4)
* **Mixtral-8x7B-Instruct-v0.1:** ~0.05 (0), ~0.1 (1), ~0.15 (2), ~0.4 (3), ~0.3 (4)
* **Qwen2-3.5-0.5B-Instruct:** ~0.2 (0), ~0.2 (1), ~0.2 (2), ~0.25 (3), ~0.15 (4)
* **Qwen2-5-32B-Instruct:** ~0.05 (0), ~0.1 (1), ~0.15 (2), ~0.4 (3), ~0.3 (4)
* **Qwen2-5-3B-Instruct:** ~0.15 (0), ~0.15 (1), ~0.2 (2), ~0.3 (3), ~0.2 (4)
* **Qwen2-5-72B-Instruct:** ~0.05 (0), ~0.1 (1), ~0.15 (2), ~0.4 (3), ~0.3 (4)
* **Qwen2-5-7B-Instruct:** ~0.1 (0), ~0.15 (1), ~0.2 (2), ~0.35 (3), ~0.2 (4)
* **claude-3-haiku-20240307:** ~0.1 (0), ~0.1 (1), ~0.2 (2), ~0.3 (3), ~0.3 (4)
* **claude-3-sonnet-202405-13:** ~0.05 (0), ~0.05 (1), ~0.1 (2), ~0.3 (3), ~0.5 (4)
* **gpt-4o-mini-2024-07-18:** ~0.05 (0), ~0.05 (1), ~0.1 (2), ~0.2 (3), ~0.6 (4)
### Key Observations
* **gpt-4o-mini-2024-07-18** and **claude-3-sonnet-202405-13** have the highest proportion of rating 4, indicating they received the most positive evaluations.
* **Llama-3-2-1B-Instruct** and **Qwen2-3.5-0.5B-Instruct** have the highest proportion of rating 0, suggesting they received the most negative evaluations.
* Most models have a significant proportion of ratings in the 2 and 3 range, indicating a mixed reception.
* There's a clear trend of larger models (e.g., Llama-3-70B-Instruct, Mixtral-8x7B-Instruct-v0.1) tending to receive higher ratings (more 3s and 4s) compared to smaller models.
### Interpretation
The chart provides a comparative assessment of the performance of different language models, as judged by the "claude-3-sonnet-20241022" evaluator. The stacked bar chart effectively visualizes the distribution of ratings, allowing for quick identification of models that consistently receive high or low scores.
The dominance of ratings 3 and 4 for models like gpt-4o-mini-2024-07-18 and claude-3-sonnet-202405-13 suggests these models are generally considered to be of higher quality or more useful. Conversely, the higher proportion of rating 0 for models like Llama-3-2-1B-Instruct and Qwen2-3.5-0.5B-Instruct indicates potential issues with their performance or usability.
The observed trend of larger models receiving higher ratings aligns with the general expectation that model capacity and complexity correlate with performance. However, it's important to note that this is just one evaluator's perspective, and the results may vary depending on the evaluation criteria and the specific tasks used. Further investigation with different evaluators and datasets would be necessary to draw more definitive conclusions. The data suggests a clear hierarchy of model performance, with the newer and larger models generally outperforming the smaller ones.