# Technical Document Extraction: Graph Analysis
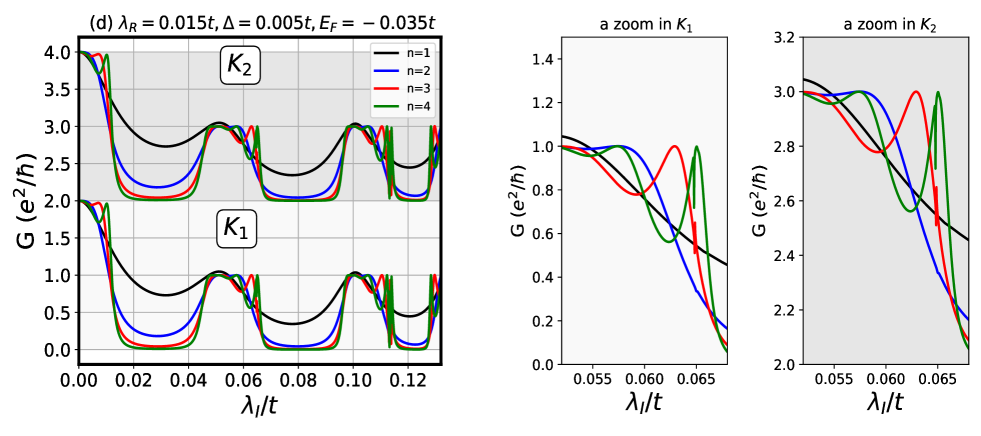
## Main Chart (Left Panel)
### Subplots
- **K1 (Top Subplot)**
- **X-axis**: λ_I/t (ranging from 0.00 to 0.12)
- **Y-axis**: G (e²/ħ) (ranging from 0.0 to 4.0)
- **Lines**:
- **n=1** (Black): Oscillatory trend with peaks at ~3.5, ~2.5, and ~1.5. Amplitude decreases slightly with increasing λ_I/t.
- **n=2** (Blue): Similar oscillations to n=1 but with reduced amplitude (~3.0 to ~2.0).
- **n=3** (Red): Further reduced amplitude (~2.5 to ~1.8).
- **n=4** (Green): Lowest amplitude (~2.0 to ~1.5).
- **K2 (Bottom Subplot)**
- **X-axis**: λ_I/t (same range as K1)
- **Y-axis**: G (e²/ħ) (same scale as K1)
- **Lines**:
- **n=1** (Black): Peaks at ~3.5, ~2.5, and ~1.5. Slightly sharper oscillations than K1.
- **n=2** (Blue): Peaks at ~3.0, ~2.0, and ~1.5.
- **n=3** (Red): Peaks at ~2.5, ~1.8, and ~1.3.
- **n=4** (Green): Peaks at ~2.0, ~1.5, and ~1.0.
### Parameters
- λ_R = 0.015t
- Δ = 0.005t
- E_F = -0.035t
## Zoomed-In Charts (Right Panels)
### K1 Zoom (Left Right Panel)
- **X-axis**: λ_I/t (0.055 to 0.065)
- **Y-axis**: G (e²/ħ) (0.0 to 1.4)
- **Lines**:
- **n=1** (Black): Sharp dip from ~1.2 to ~0.8, then rise to ~1.0.
- **n=2** (Blue): Dips to ~0.6, then rises to ~0.8.
- **n=3** (Red): Dips to ~0.4, then rises to ~0.6.
- **n=4** (Green): Dips to ~0.2, then rises to ~0.4.
### K2 Zoom (Right Right Panel)
- **X-axis**: λ_I/t (0.055 to 0.065)
- **Y-axis**: G (e²/ħ) (0.0 to 3.2)
- **Lines**:
- **n=1** (Black): Sharp dip from ~3.0 to ~2.5, then rise to ~2.8.
- **n=2** (Blue): Dips to ~2.6, then rises to ~2.8.
- **n=3** (Red): Dips to ~2.4, then rises to ~2.6.
- **n=4** (Green): Dips to ~2.2, then rises to ~2.4.
## Legend
- **Location**: Right side of the main chart.
- **Labels**:
- **n=1**: Black
- **n=2**: Blue
- **n=3**: Red
- **n=4**: Green
## Key Observations
1. **Oscillatory Behavior**: All lines exhibit periodic oscillations in G as λ_I/t increases.
2. **Amplitude Decay**: Higher n values correspond to lower oscillation amplitudes.
3. **Zoomed-In Details**: In the narrow λ_I/t range (0.055–0.065), lines exhibit sharper features and crossings, indicating sensitivity to small parameter changes.
4. **Parameter Influence**: The constants λ_R, Δ, and E_F likely modulate the oscillation frequency and amplitude.
## Spatial Grounding
- **Legend Colors**: Confirmed matches with line colors in all subplots.
- **Axis Labels**: Consistent across all panels.
## Notes
- No numerical data table is present; trends are inferred visually.
- Shaded regions in the main chart are unlabeled and likely serve as visual guides.