## Diagram: Transformer Attention Head Visualization
### Overview
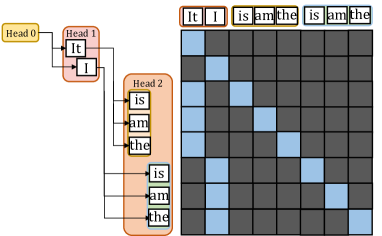
The image is a technical diagram illustrating the attention mechanism in a transformer neural network model. It consists of two main parts: a flowchart on the left showing the hierarchical structure of attention heads and their associated tokens, and an attention weight matrix (heatmap) on the right visualizing the attention scores between tokens. The diagram demonstrates how different attention heads focus on different subsets of the input sequence.
### Components/Axes
**Left Flowchart:**
- **Head 0** (Yellow box, top-left): Connected to tokens "It" and "I".
- **Head 1** (Red box, below Head 0): Connected to tokens "is", "am", and "the".
- **Head 2** (Orange box, below Head 1): Connected to tokens "is", "am", and "the".
- **Connections:** Lines show which tokens each head processes. Head 0 processes the first two tokens, while Heads 1 and 2 process the subsequent three tokens.
**Right Attention Matrix:**
- **Type:** 5x5 grid (heatmap).
- **Row Labels (Left side, vertical):** "It", "I", "is", "am", "the" (from top to bottom).
- **Column Labels (Top side, horizontal):** "It", "I", "is", "am", "the" (from left to right).
- **Legend/Color Key:** Blue squares indicate high attention weight (value ≈ 1). Dark gray squares indicate low or zero attention weight (value ≈ 0).
- **Spatial Layout:** The matrix is positioned to the right of the flowchart. The row labels align with the tokens listed in the flowchart.
### Detailed Analysis
**Attention Matrix Data Points (Row-by-Row Analysis):**
1. **Row "It" (Top row):**
* Column "It": Blue (High attention).
* Column "I": Blue (High attention).
* Columns "is", "am", "the": Dark gray (Low attention).
* **Trend:** The token "It" attends strongly only to itself and the token "I".
2. **Row "I" (Second row):**
* Column "It": Blue (High attention).
* Column "I": Blue (High attention).
* Columns "is", "am", "the": Dark gray (Low attention).
* **Trend:** The token "I" attends strongly only to itself and the token "It".
3. **Row "is" (Third row):**
* Column "is": Blue (High attention).
* Column "am": Blue (High attention).
* Column "the": Blue (High attention).
* Columns "It", "I": Dark gray (Low attention).
* **Trend:** The token "is" attends strongly to itself and the tokens "am" and "the".
4. **Row "am" (Fourth row):**
* Column "is": Blue (High attention).
* Column "am": Blue (High attention).
* Column "the": Blue (High attention).
* Columns "It", "I": Dark gray (Low attention).
* **Trend:** The token "am" attends strongly to itself and the tokens "is" and "the".
5. **Row "the" (Bottom row):**
* Column "is": Blue (High attention).
* Column "am": Blue (High attention).
* Column "the": Blue (High attention).
* Columns "It", "I": Dark gray (Low attention).
* **Trend:** The token "the" attends strongly to itself and the tokens "is" and "am".
**Cross-Reference with Flowchart:**
* The attention pattern in the matrix perfectly aligns with the head groupings in the flowchart.
* **Head 0 Group ("It", "I"):** These two tokens only attend to each other within their group (forming a 2x2 blue block in the top-left of the matrix).
* **Heads 1 & 2 Group ("is", "am", "the"):** These three tokens only attend to each other within their group (forming a 3x3 blue block in the bottom-right of the matrix).
* There is **zero attention** (all dark gray) between the two groups.
### Key Observations
1. **Complete Separation:** The attention mechanism has cleanly separated the input sequence into two distinct, non-interacting clusters: {"It", "I"} and {"is", "am", "the"}.
2. **Self-Attention within Clusters:** Within each cluster, every token attends strongly to every other token in the same cluster, including itself. This creates two perfect, isolated cliques.
3. **Head Specialization:** The flowchart suggests that Head 0 is specialized for the first cluster, while Heads 1 and 2 are specialized for the second cluster. The matrix shows the combined result of these heads' attention patterns.
4. **Binary Attention:** The attention weights appear to be binary (either fully on or fully off), with no intermediate values shown. This is a simplified visualization.
### Interpretation
This diagram illustrates a scenario where a transformer's multi-head attention has learned a **hard, syntactic or semantic partitioning** of the input sentence. The sentence appears to be "It I is am the" (which is grammatically unusual, suggesting it might be a constructed example).
The data suggests the model has identified two coherent phrases or conceptual units:
1. A **subject/pronoun cluster** ("It", "I").
2. A **verb/article cluster** ("is", "am", "the").
The complete lack of cross-attention between these clusters is the most significant finding. In a typical sentence, one would expect some attention flow between subjects and verbs. This pattern could indicate:
* **A specialized task:** The model might be performing a task like coreference resolution (linking "It" and "I") that requires isolating pronouns.
* **An artifact of training:** The model may have overfit to a pattern where these specific words are always grouped separately.
* **A visualization of a specific layer/head:** This likely shows the output of a particular attention head that has learned this specific, isolated function, while other heads in the network handle the cross-cluster relationships.
The diagram effectively communicates how attention heads can act as **feature detectors** or **cluster formers**, grouping related tokens together while ignoring others, which is a fundamental operation enabling transformers to build contextual representations.