## Heatmap: Needle in a Haystack Evaluation
### Overview
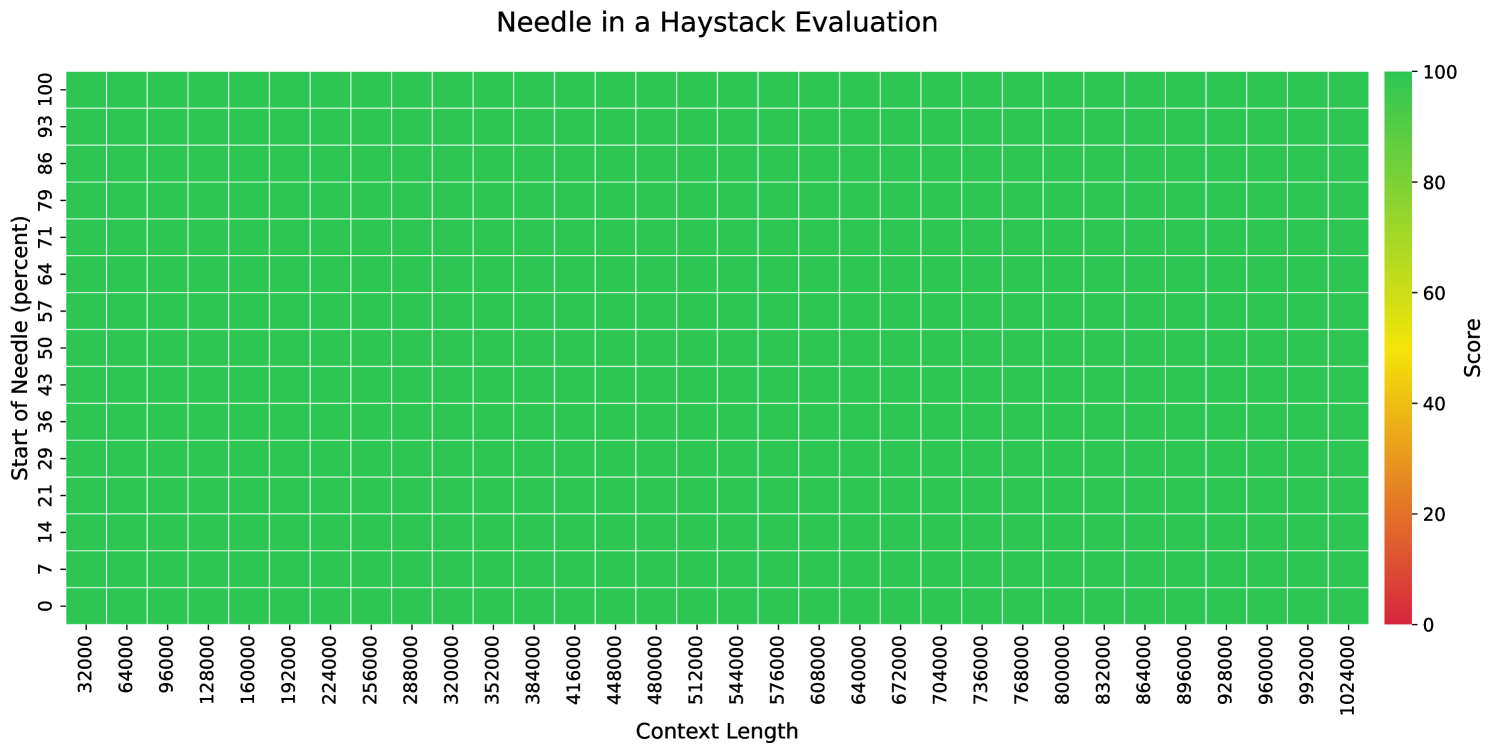
The image presents a heatmap visualizing the results of a "Needle in a Haystack Evaluation". The heatmap displays a score based on two variables: "Context Length" and "Start of Needle (percent)". The color gradient represents the score, ranging from red (low score) to green (high score).
### Components/Axes
* **Title:** "Needle in a Haystack Evaluation" - positioned at the top-center.
* **X-axis:** "Context Length" - ranging from 32000 to 1024000, with increments of 96000.
* **Y-axis:** "Start of Needle (percent)" - ranging from 0 to 100, with increments of 7. The values are: 0, 7, 14, 21, 29, 36, 43, 50, 57, 64, 71, 79, 86, 93, 100.
* **Color Scale/Legend:** Located on the right side of the heatmap. It maps colors to scores:
* Red: 0
* Orange/Yellow: ~20-40
* Green: ~60-80
* Light Green/Yellow: ~80-100
### Detailed Analysis
The heatmap is a grid of colored cells, each representing a combination of Context Length and Start of Needle percentage. The majority of the cells are colored green, indicating a high score (approximately 80-100). There are some cells with lower scores (yellow/orange) concentrated in the bottom-left corner of the heatmap.
Let's analyze the data points based on the color scale:
* **Context Length 32000:**
* Start of Needle 0%: Score is approximately 10-20 (yellow).
* Start of Needle 7%: Score is approximately 20-30 (yellow).
* Start of Needle 14%: Score is approximately 40-50 (orange).
* Start of Needle 21% and above: Score is approximately 80-100 (green).
* **Context Length 96000:**
* Start of Needle 0%: Score is approximately 20-30 (yellow).
* Start of Needle 7%: Score is approximately 40-50 (orange).
* Start of Needle 14% and above: Score is approximately 80-100 (green).
* **Context Length 192000:**
* Start of Needle 0%: Score is approximately 40-50 (orange).
* Start of Needle 7% and above: Score is approximately 80-100 (green).
* **Context Length 288000 and above:**
* All Start of Needle percentages: Score is consistently approximately 80-100 (green).
The trend is that as the Context Length increases, the score generally increases, especially for lower Start of Needle percentages. For larger context lengths, the starting position of the needle has minimal impact on the score.
### Key Observations
* The heatmap shows a strong positive correlation between Context Length and Score.
* The score is more sensitive to the Start of Needle percentage when the Context Length is small.
* There are no significant outliers or anomalies. The data appears relatively smooth and consistent.
* The bottom-left corner (small context length, low start of needle percentage) consistently exhibits the lowest scores.
### Interpretation
This heatmap likely represents the performance of an algorithm or system in finding a "needle" (a specific target) within a "haystack" (a larger dataset) under varying conditions. The "Context Length" represents the size of the haystack, and the "Start of Needle (percent)" represents the position of the needle within the haystack.
The data suggests that the system performs well when the haystack is large (high Context Length), regardless of where the needle is located. However, when the haystack is small, the system's performance is more sensitive to the needle's position. A low score in the bottom-left corner indicates that finding the needle is difficult when the haystack is small and the needle is near the beginning.
This could be due to several factors, such as the algorithm requiring a certain amount of context to effectively search for the needle, or the algorithm being biased towards finding the needle in certain positions. The consistent high scores for larger context lengths suggest that the algorithm scales well with increasing data size.