## Chart: Distribution of Tensor Values
### Overview
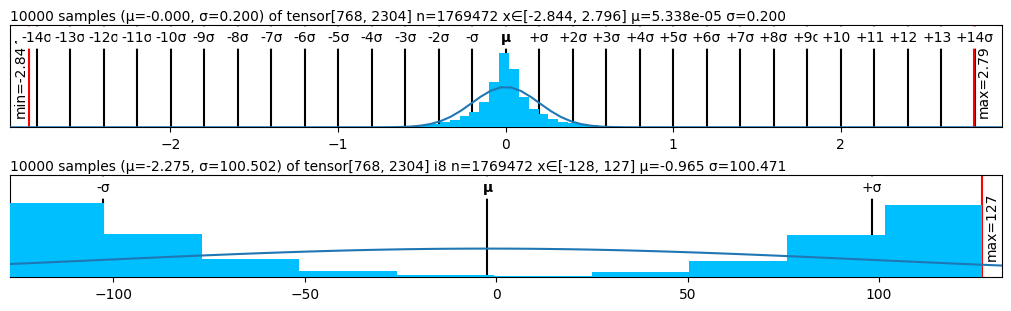
The image presents two histograms visualizing the distribution of values within a tensor. Both histograms display the frequency of values within defined bins, overlaid with a smoothed curve representing the estimated probability density function. The top histogram focuses on a tensor with a mean of 0.00 and a standard deviation of 0.200, while the bottom histogram displays a tensor with a mean of -2.275 and a standard deviation of 100.502.
### Components/Axes
* **Top Histogram:**
* **X-axis:** Values ranging from approximately -140 to +140, with tick marks at intervals of 10, labeled as -140, -130, ..., +130, +140. Also labeled with multiples of the standard deviation: -7σ, -6σ, ..., +7σ, +8σ, +9σ.
* **Y-axis:** Frequency (not explicitly labeled, but implied by the histogram bars).
* **Title:** "10000 samples (μ=-0.00, σ=0.200) of tensor[768, 2304] n=1769472 xE[-2.844, 2.796] μ=5.338e-05 σ=0.200"
* **Vertical Lines:** Indicate standard deviations from the mean (μ).
* **Bottom Histogram:**
* **X-axis:** Values ranging from approximately -120 to +120, with tick marks at intervals of 50, labeled as -100, -50, 0, 50, 100. Also labeled with -σ, μ, +σ.
* **Y-axis:** Frequency (not explicitly labeled, but implied by the histogram bars).
* **Title:** "10000 samples (μ=-2.275, σ=100.502) of tensor[768, 2304] n=1769472 xE[-128, 127] μ=-0.965 σ=100.471"
* **Vertical Lines:** Indicate standard deviations from the mean (μ).
* **Color Scheme:**
* Histogram bars: Light blue.
* Smoothed curve: Dark blue.
* Vertical lines: Red.
### Detailed Analysis or Content Details
* **Top Histogram:**
* The distribution is approximately normal, centered around 0. The peak of the distribution is near 0.
* The range of values is approximately from -2.844 to 2.796.
* The mean (μ) is reported as 0.00, with a standard deviation (σ) of 0.200.
* The minimum value observed is -2.844, and the maximum is 2.796.
* **Bottom Histogram:**
* The distribution is wider and less symmetrical than the top histogram.
* The range of values is approximately from -128 to 127.
* The mean (μ) is reported as -2.275, with a standard deviation (σ) of 100.502.
* The minimum value observed is -128, and the maximum is 127.
### Key Observations
* The top histogram shows a tightly clustered distribution around zero, indicating low variance.
* The bottom histogram shows a much wider distribution, indicating high variance.
* The bottom histogram's mean is significantly negative, while the top histogram's mean is close to zero.
* The standard deviation of the bottom histogram is much larger than that of the top histogram.
### Interpretation
The two histograms represent the distributions of values within two different tensors. The significant differences in mean and standard deviation suggest that these tensors contain fundamentally different data. The top tensor appears to represent values centered around zero with minimal spread, potentially representing normalized data or small perturbations. The bottom tensor, on the other hand, has a negative mean and a large standard deviation, indicating a wider range of values and a potential bias towards negative numbers. The "xE" notation in the titles likely refers to the minimum and maximum observed values within the tensor. The "n" value represents the total number of samples. The difference in scale and distribution suggests these tensors are likely derived from different sources or represent different features within a larger dataset. The histograms provide a visual summary of the central tendency and dispersion of the data within each tensor, which is crucial for understanding their characteristics and potential use in downstream analysis.