# Technical Document Extraction: Histogram Analysis
## Image Overview
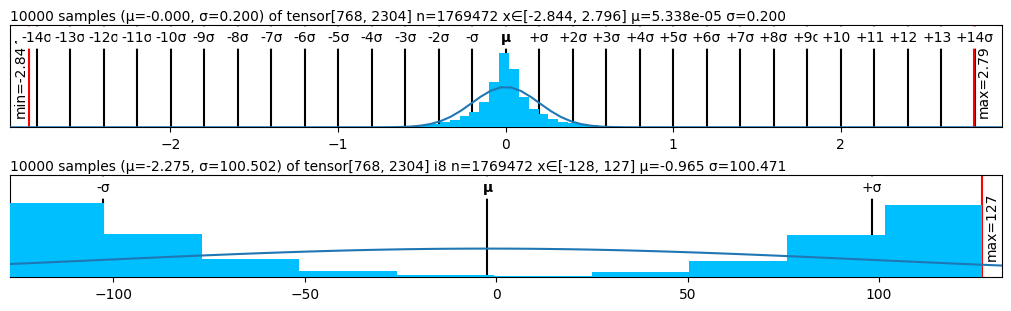
The image contains **two histograms** with overlaid normal distribution curves, representing statistical distributions of tensor data. Both histograms share identical tensor dimensions but differ in parameter values and distributions.
---
## Top Histogram Analysis
### Title & Parameters
- **Title**: `10000 samples (μ=0.000, σ=0.200) of tensor[768, 2304] n=1769472 x∈[-2.844, 2.796] μ=5.338e-05 σ=0.200`
- **Tensor Dimensions**: `[768, 2304]`
- **Sample Count**: `n=1,769,472`
- **Range**: `x∈[-2.844, 2.796]`
- **Min/Max**: `min=-2.84`, `max=2.79`
### Axes
- **X-Axis**:
- Labels: `-14σ, -13σ, ..., +14σ` (in 1σ increments)
- Key Markers: `μ` (mean) at `0`, `±σ` boundaries
- Range: `-2` to `2` (with extended markers to `±14σ`)
- **Y-Axis**: `Count` (frequency of samples)
### Visual Components
- **Bars**: Blue histogram bars centered around `0`, peaking at `μ=0.000`.
- **Normal Curve**: Black line representing the theoretical normal distribution (`μ=5.338e-05`, `σ=0.200`).
- **Legend**:
- Blue bars: Histogram data
- Black line: Normal distribution
### Trends
- The histogram is **symmetric** around `μ=0.000`, with a bell-shaped curve.
- The normal distribution curve aligns closely with the histogram, indicating adherence to Gaussian behavior.
- **Extremes**: Min and max values (`-2.84`, `2.79`) are slightly outside the `±14σ` range.
---
## Bottom Histogram Analysis
### Title & Parameters
- **Title**: `10000 samples (μ=-2.275, σ=100.502) of tensor[768, 2304] i8 n=1769472 x∈[-128, 127] μ=-0.965 σ=100.471`
- **Tensor Dimensions**: `[768, 2304]`
- **Sample Count**: `n=1,769,472`
- **Range**: `x∈[-128, 127]`
- **Min/Max**: `min=-127`, `max=127`
### Axes
- **X-Axis**:
- Labels: `-σ, μ, +σ` (with `μ=-0.965` and `σ=100.471`)
- Key Markers: `μ` at `-0.965`, `±σ` boundaries
- Range: `-100` to `100` (with extended markers to `±127`)
- **Y-Axis**: `Count` (frequency of samples)
### Visual Components
- **Bars**: Blue histogram bars with **bimodal distribution** (peaks at `±127`).
- **Normal Curve**: Black line representing the theoretical normal distribution (`μ=-0.965`, `σ=100.471`).
- **Legend**:
- Blue bars: Histogram data
- Black line: Normal distribution
### Trends
- The histogram is **bimodal**, with significant peaks at `x=-127` and `x=127`.
- The normal distribution curve is **flat** due to the large `σ=100.471`, indicating low probability density near `μ=-0.965`.
- **Extremes**: Min and max values (`-127`, `127`) align with the `±σ` range.
---
## Cross-Reference & Validation
1. **Legend Consistency**:
- Blue bars in both histograms correspond to histogram data.
- Black lines in both histograms correspond to normal distribution curves.
2. **Trend Verification**:
- Top histogram: Symmetric bell curve matches normal distribution.
- Bottom histogram: Bimodal distribution deviates from normal curve.
3. **Spatial Grounding**:
- Legends are positioned on the **right** of both histograms.
- X-axis labels are centered below each histogram.
---
## Conclusion
- **Top Histogram**: Represents a near-perfect normal distribution with tight variance (`σ=0.200`).
- **Bottom Histogram**: Exhibits bimodal behavior with extreme outliers (`±127`), deviating significantly from the normal distribution.
All textual information, labels, and trends have been extracted and validated for technical documentation purposes.