## Diagram: Hierarchical Clustering of Data Arrays
### Overview
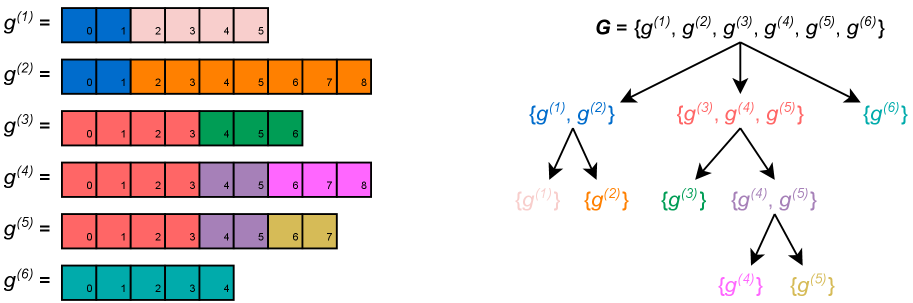
The image presents a visual representation of a hierarchical clustering structure. On the left, there are six distinct data arrays, labeled $g^{(1)}$ through $g^{(6)}$, each composed of color-coded segments containing numerical indices. On the right, a tree diagram illustrates the hierarchical grouping of these arrays, where the color of the text in the tree nodes corresponds to the color of the specific segments within the arrays on the left.
### Components/Axes
* **Left Panel (Data Arrays):** Six horizontal bars representing arrays $g^{(1)}$ through $g^{(6)}$. Each bar is divided into numbered cells starting from 0.
* **Right Panel (Tree Diagram):** A hierarchical tree structure starting from a root node $G$.
* **Color Coding:** The colors used in the array segments on the left are mapped directly to the text colors of the corresponding leaf nodes in the tree diagram on the right.
### Detailed Analysis
#### Left Panel: Data Arrays
The arrays are listed vertically. Each array is segmented by color, and each segment contains sequential integers.
* **$g^{(1)}$**: Length 6 (indices 0-5).
* Segment 1: Blue (indices 0-1)
* Segment 2: Light Pink (indices 2-5)
* **$g^{(2)}$**: Length 9 (indices 0-8).
* Segment 1: Blue (indices 0-1)
* Segment 2: Orange (indices 2-8)
* **$g^{(3)}$**: Length 7 (indices 0-6).
* Segment 1: Red (indices 0-3)
* Segment 2: Green (indices 4-6)
* **$g^{(4)}$**: Length 9 (indices 0-8).
* Segment 1: Red (indices 0-3)
* Segment 2: Purple (indices 4-5)
* Segment 3: Magenta (indices 6-8)
* **$g^{(5)}$**: Length 8 (indices 0-7).
* Segment 1: Red (indices 0-3)
* Segment 2: Purple (indices 4-5)
* Segment 3: Gold/Tan (indices 6-7)
* **$g^{(6)}$**: Length 5 (indices 0-4).
* Segment 1: Teal (indices 0-4)
#### Right Panel: Tree Diagram
The tree branches downward from the root $G = \{g^{(1)}, g^{(2)}, g^{(3)}, g^{(4)}, g^{(5)}, g^{(6)}\}$.
* **Level 1 Branches:**
* **Left Branch (Blue text):** $\{g^{(1)}, g^{(2)}\}$
* **Middle Branch (Red text):** $\{g^{(3)}, g^{(4)}, g^{(5)}\}$
* **Right Branch (Teal text):** $\{g^{(6)}\}$
* **Level 2 Branches:**
* From $\{g^{(1)}, g^{(2)}\}$:
* Left: $\{g^{(1)}\}$ (Light Pink text)
* Right: $\{g^{(2)}\}$ (Orange text)
* From $\{g^{(3)}, g^{(4)}, g^{(5)}\}$:
* Left: $\{g^{(3)}\}$ (Green text)
* Right: $\{g^{(4)}, g^{(5)}\}$ (Purple text)
* **Level 3 Branches:**
* From $\{g^{(4)}, g^{(5)}\}$:
* Left: $\{g^{(4)}\}$ (Magenta text)
* Right: $\{g^{(5)}\}$ (Gold/Tan text)
### Key Observations
* **Shared Prefixes:** The tree structure is determined by shared segments. For example, $g^{(1)}$ and $g^{(2)}$ both start with the "Blue" segment (0-1), which is why they are grouped together in the first branch.
* **Recursive Partitioning:** The "Red" group ($g^{(3)}, g^{(4)}, g^{(5)}$) shares the "Red" segment (0-3). Within this group, $g^{(4)}$ and $g^{(5)}$ are further grouped together because they share the "Purple" segment (4-5).
* **Leaf Node Correspondence:** The final leaf nodes in the tree (e.g., $\{g^{(1)}\}$ in light pink) correspond exactly to the unique, non-shared terminal segment of the respective array on the left.
### Interpretation
This diagram illustrates a **hierarchical clustering process** (likely a decision tree or a prefix-based classification). The data arrays represent sequences or feature vectors. The algorithm partitions these sequences based on shared prefixes (the colored segments).
1. **Primary Split:** The data is split into three main clusters based on the first segment color (Blue, Red, Teal).
2. **Sub-clustering:** Within the Blue and Red clusters, the algorithm continues to split the data based on the next available shared segment.
3. **Termination:** The process terminates when a sequence has a unique terminal segment that distinguishes it from others in its immediate cluster (e.g., $g^{(4)}$ vs $g^{(5)}$).
This is a visual representation of how a system might classify complex data by iteratively identifying commonalities and separating unique features.