\n
## Diagram: Group Structure Visualization
### Overview
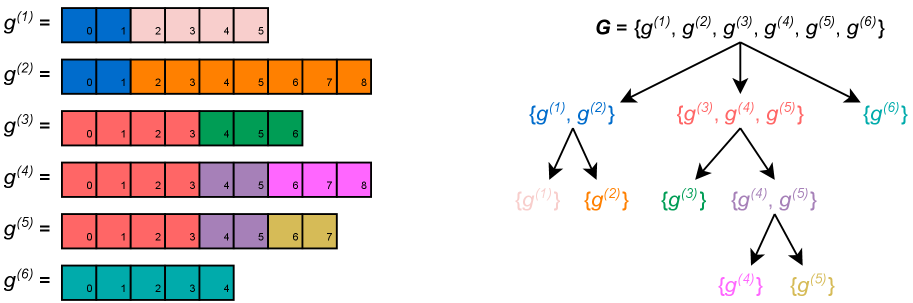
The image depicts a visual representation of a group structure, likely related to a mathematical or computational concept. It consists of six labeled sequences (g^(1) through g^(6)) displayed as horizontal bars with numbered segments, and a tree diagram illustrating the grouping of these sequences. The diagram shows how the sequences are combined into larger groups.
### Components/Axes
The diagram is composed of two main sections:
1. **Sequence Definitions:** Six horizontal bars, each labeled with "g^(i)" where 'i' ranges from 1 to 6. Each bar is divided into numbered segments, starting from 0.
2. **Tree Diagram:** A hierarchical tree structure showing how the sequences are grouped. The root node is labeled "G".
There are no explicit axes in the traditional sense, but the horizontal bars represent a sequence index, and the numbers within the bars represent segment indices. The tree diagram uses arrows to indicate the grouping relationships.
### Detailed Analysis or Content Details
**Sequence Definitions:**
* **g^(1):** Segments 0, 1, 2, 3, 4, 5. Colors: Pink, Light Blue, Pink, Light Blue, Pink, Light Blue.
* **g^(2):** Segments 0, 1, 2, 3, 4, 5, 6, 7, 8. Colors: Dark Blue, Orange, Orange, Orange, Orange, Orange, Orange, Orange, Orange.
* **g^(3):** Segments 0, 1, 2, 3, 4, 5. Colors: Pink, Light Blue, Pink, Green, Pink, Green.
* **g^(4):** Segments 0, 1, 2, 3, 4, 5, 6, 7, 8. Colors: Pink, Light Blue, Pink, Light Blue, Pink, Light Blue, Orange, Orange, Orange.
* **g^(5):** Segments 0, 1, 2, 3, 4, 5, 6, 7. Colors: Pink, Light Blue, Pink, Light Blue, Pink, Light Blue, Pink, Light Blue.
* **g^(6):** Segments 0, 1, 2, 3, 4. Colors: Dark Blue, Light Blue, Pink, Light Blue, Pink.
**Tree Diagram:**
* **Root Node (G):** G = {g^(1), g^(2), g^(3), g^(4), g^(5), g^(6)}
* **Level 1:**
* {g^(1), g^(2)} – Arrow points to this group.
* {g^(3), g^(4), g^(5)} – Arrow points to this group.
* {g^(6)} – Arrow points to this group.
* **Level 2:**
* {g^(1)} – Branching from {g^(1), g^(2)}.
* {g^(2)} – Branching from {g^(1), g^(2)}.
* {g^(3)} – Branching from {g^(3), g^(4), g^(5)}.
* {g^(4), g^(5)} – Branching from {g^(3), g^(4), g^(5)}.
* **Level 3:**
* {g^(4)} – Branching from {g^(4), g^(5)}.
* {g^(5)} – Branching from {g^(4), g^(5)}.
### Key Observations
The sequences g^(1) through g^(6) have varying lengths. The tree diagram shows a hierarchical grouping of these sequences. The grouping appears to be based on some underlying criteria, potentially related to the color patterns or segment values within the sequences. The sequences g^(1), g^(3), g^(4), g^(5) and g^(6) share the color pink, while g^(2) is predominantly orange.
### Interpretation
This diagram likely represents a grouping or clustering operation performed on a set of sequences. The sequences themselves could represent data points, code segments, or any other ordered collection of elements. The tree diagram illustrates how these sequences are organized into larger groups based on some similarity or relationship. The color coding within the sequences might be a visual cue to highlight these relationships.
The structure suggests a recursive grouping process. The root node G contains all sequences, which are then divided into smaller groups, and those groups are further subdivided until individual sequences are reached. This could be a representation of a divide-and-conquer algorithm, a hierarchical classification scheme, or a data partitioning strategy.
The fact that some sequences are grouped together while others remain isolated suggests that there are distinct characteristics that differentiate the sequences. The color patterns might be indicative of these characteristics. Without further context, it is difficult to determine the specific meaning of the diagram, but it clearly demonstrates a hierarchical organization of a set of sequences.