## Hierarchical Diagram with Segmented Bars: Group Composition and Relationships
### Overview
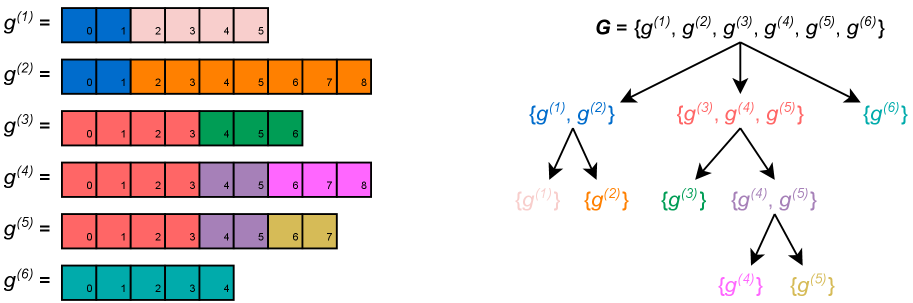
The image consists of two primary components:
1. **Left Side**: Six horizontal bars labeled `g^(1)` to `g^(6)`, each divided into colored segments with numerical labels (0-8).
2. **Right Side**: A hierarchical tree diagram (`G`) showing relationships between the `g^(i)` sets, with color-coded groupings and arrows indicating connections.
---
### Components/Axes
#### Left Side (Segmented Bars)
- **Labels**: `g^(1)` to `g^(6)` (top to bottom).
- **Segments**:
- Each bar is divided into colored segments with numerical labels (0-8).
- Colors vary per bar, with no explicit legend provided for segment meanings.
- **Example**:
- `g^(1)`: Blue (0-1), Pink (2-4), Light Pink (5).
- `g^(2)`: Orange (0-8).
- `g^(3)`: Red (0-3), Green (4-6).
- `g^(4)`: Red (0-3), Purple (4-5), Pink (6-8).
- `g^(5)`: Red (0-3), Purple (4-5), Yellow (6-7).
- `g^(6)`: Teal (0-4).
#### Right Side (Hierarchical Diagram)
- **Root Node**: `G = {g^(1), g^(2), g^(3), g^(4), g^(5), g^(6)}`.
- **Branches**:
- **First Level**:
- Left: `{g^(1), g^(2)}` (Blue + Orange).
- Center: `{g^(3), g^(4), g^(5)}` (Red + Green + Purple).
- Right: `{g^(6)}` (Teal).
- **Second Level**:
- `{g^(1), g^(2)}` splits into `{g^(1)}` (Blue) and `{g^(2)}` (Orange).
- `{g^(3), g^(4), g^(5)}` splits into `{g^(3)}` (Red), `{g^(4), g^(5)}` (Green + Purple).
- `{g^(4), g^(5)}` splits into `{g^(4)}` (Green) and `{g^(5)}` (Purple).
- **Legend**: Colors correspond to groupings (e.g., Blue = `{g^(1), g^(2)}`, Red = `{g^(3)}`).
---
### Detailed Analysis
#### Left Side (Segmented Bars)
- **g^(1)**: 6 segments (0-5). Colors: Blue (0-1), Pink (2-4), Light Pink (5).
- **g^(2)**: 9 segments (0-8). Uniform Orange.
- **g^(3)**: 7 segments (0-6). Colors: Red (0-3), Green (4-6).
- **g^(4)**: 9 segments (0-8). Colors: Red (0-3), Purple (4-5), Pink (6-8).
- **g^(5)**: 8 segments (0-7). Colors: Red (0-3), Purple (4-5), Yellow (6-7).
- **g^(6)**: 5 segments (0-4). Uniform Teal.
#### Right Side (Hierarchical Diagram)
- **Root to Leaves Flow**:
- `G` branches into three main groups, which further subdivide into individual `g^(i)` elements.
- Colors in the diagram match the dominant colors of the corresponding `g^(i)` bars (e.g., `g^(3)` is Red in both the bar and diagram).
---
### Key Observations
1. **Color Consistency**:
- Colors in the diagram (e.g., Blue for `{g^(1), g^(2)}`) align with the dominant colors in the left-side bars.
- Example: `g^(3)` uses Red in both the bar and diagram.
2. **Segment Lengths**:
- Bars vary in length: `g^(2)` and `g^(4)` are longest (9 segments), while `g^(6)` is shortest (5 segments).
3. **Hierarchical Grouping**:
- The diagram suggests a taxonomy where `G` is the universal set, partitioned into subsets (e.g., `{g^(1), g^(2)}`, `{g^(3), g^(4), g^(5)}`, `{g^(6)}`).
4. **Numerical Labels**:
- Numbers in segments (0-8) may represent identifiers, counts, or ordinal positions, but their semantic meaning is unclear without additional context.
---
### Interpretation
- **Purpose of the Diagram**:
- The hierarchical tree (`G`) likely represents a classification or dependency structure among the `g^(i)` elements. For example, `{g^(1), g^(2)}` could denote a shared category or relationship between these groups.
- **Relationship Between Components**:
- The left-side bars show the internal composition of each `g^(i)` (via colored segments), while the right-side diagram illustrates how these groups interrelate at higher levels.
- **Notable Patterns**:
- `g^(2)` and `g^(4)` have uniform colors (Orange and Pink/Purple, respectively), suggesting homogeneity within these groups.
- `g^(3)` and `g^(5)` exhibit mixed colors, indicating potential subcategories or transitions.
- **Uncertainties**:
- The exact meaning of numerical labels (0-8) and segment colors remains ambiguous without domain-specific context.
- The hierarchical diagram’s grouping logic (e.g., why `{g^(3), g^(4), g^(5)}` are grouped together) is not explicitly explained.
---
### Conclusion
The image combines segmented bars (showing detailed compositions of `g^(i)`) with a hierarchical diagram (showing relationships between groups). While the visual structure is clear, the semantic interpretation of colors, numbers, and groupings requires additional context to fully resolve.