\n
## Line Chart: I-Don't-Know Rate vs. Layer for Llama Models
### Overview
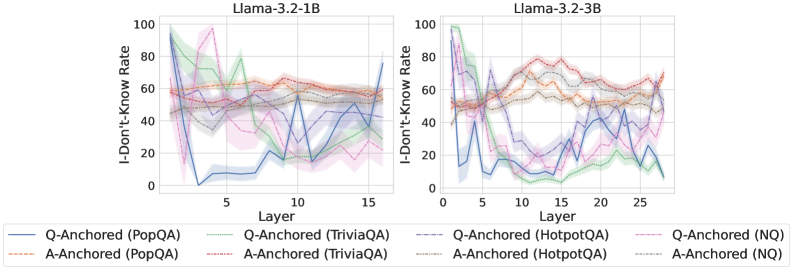
The image presents two line charts, side-by-side, displaying the "I-Don't-Know Rate" as a function of "Layer" for two different Llama models: Llama-3.2-1B and Llama-3.2-3B. Each chart shows multiple lines representing different question-answering datasets and anchoring methods. The charts are designed to compare how the rate of the model responding with "I-Don't-Know" changes as the model's layers increase.
### Components/Axes
* **X-axis:** "Layer" - Ranges from approximately 0 to 15 for the Llama-3.2-1B chart and from 0 to 25 for the Llama-3.2-3B chart.
* **Y-axis:** "I-Don't-Know Rate" - Ranges from 0 to 100.
* **Title (Left Chart):** "Llama-3.2-1B"
* **Title (Right Chart):** "Llama-3.2-3B"
* **Legend:** Located at the bottom of the image, contains the following labels and corresponding line styles/colors:
* Q-Anchored (PopQA) - Solid Blue Line
* A-Anchored (PopQA) - Solid Orange Line
* Q-Anchored (TriviaQA) - Solid Green Line
* A-Anchored (TriviaQA) - Solid Purple Line
* Q-Anchored (HotpotQA) - Dashed Blue Line
* A-Anchored (HotpotQA) - Dashed Orange Line
* Q-Anchored (NQ) - Dashed Green Line
* A-Anchored (NQ) - Dashed Purple Line
### Detailed Analysis or Content Details
**Llama-3.2-1B Chart:**
* **Q-Anchored (PopQA):** Starts at approximately 15, drops to a minimum of around 10 at layer 3, then gradually increases to approximately 55 by layer 15.
* **A-Anchored (PopQA):** Starts at approximately 60, decreases to a minimum of around 40 at layer 3, then fluctuates between 50 and 65 until layer 15.
* **Q-Anchored (TriviaQA):** Starts at approximately 85, drops sharply to around 20 at layer 3, then increases to approximately 50 by layer 15.
* **A-Anchored (TriviaQA):** Starts at approximately 70, decreases to around 30 at layer 3, then increases to approximately 60 by layer 15.
* **Q-Anchored (HotpotQA):** Starts at approximately 60, decreases to around 25 at layer 3, then fluctuates between 40 and 60 until layer 15.
* **A-Anchored (HotpotQA):** Starts at approximately 65, decreases to around 35 at layer 3, then fluctuates between 45 and 65 until layer 15.
* **Q-Anchored (NQ):** Starts at approximately 75, drops to around 25 at layer 3, then increases to approximately 55 by layer 15.
* **A-Anchored (NQ):** Starts at approximately 70, decreases to around 30 at layer 3, then increases to approximately 60 by layer 15.
**Llama-3.2-3B Chart:**
* **Q-Anchored (PopQA):** Starts at approximately 15, drops to a minimum of around 10 at layer 3, then fluctuates between 30 and 60 until layer 25.
* **A-Anchored (PopQA):** Starts at approximately 60, decreases to a minimum of around 40 at layer 3, then fluctuates between 50 and 70 until layer 25.
* **Q-Anchored (TriviaQA):** Starts at approximately 85, drops sharply to around 20 at layer 3, then increases to approximately 50 by layer 25.
* **A-Anchored (TriviaQA):** Starts at approximately 70, decreases to around 30 at layer 3, then increases to approximately 60 by layer 25.
* **Q-Anchored (HotpotQA):** Starts at approximately 60, decreases to around 25 at layer 3, then fluctuates between 40 and 60 until layer 25.
* **A-Anchored (HotpotQA):** Starts at approximately 65, decreases to around 35 at layer 3, then fluctuates between 45 and 65 until layer 25.
* **Q-Anchored (NQ):** Starts at approximately 75, drops to around 25 at layer 3, then increases to approximately 55 by layer 25.
* **A-Anchored (NQ):** Starts at approximately 70, decreases to around 30 at layer 3, then increases to approximately 60 by layer 25.
### Key Observations
* All lines in both charts exhibit a significant drop in "I-Don't-Know Rate" within the first few layers (up to layer 3).
* After the initial drop, the lines generally stabilize or exhibit more gradual increases.
* The "Q-Anchored" lines tend to have lower "I-Don't-Know Rates" than the corresponding "A-Anchored" lines across all datasets.
* The "TriviaQA" dataset consistently shows a higher initial "I-Don't-Know Rate" compared to other datasets.
* The Llama-3.2-3B model generally exhibits a more stable "I-Don't-Know Rate" across layers compared to the Llama-3.2-1B model.
### Interpretation
The data suggests that increasing the number of layers in the Llama models initially improves their ability to answer questions, as evidenced by the decrease in the "I-Don't-Know Rate." However, beyond a certain point (around layer 3), the improvement plateaus, and the rate may even slightly increase. The difference between "Q-Anchored" and "A-Anchored" methods indicates that anchoring questions may be more effective than anchoring answers in reducing uncertainty. The higher initial "I-Don't-Know Rate" for the "TriviaQA" dataset suggests that this dataset presents more challenging questions for the models. The greater stability observed in the Llama-3.2-3B model suggests that a larger model size can lead to more consistent performance across layers. The charts provide valuable insights into the behavior of these language models and can inform strategies for improving their performance and reducing uncertainty in their responses.