## Line Graphs: I-Don't-Know Rate Across Layers in LLaMA-3.2 Models
### Overview
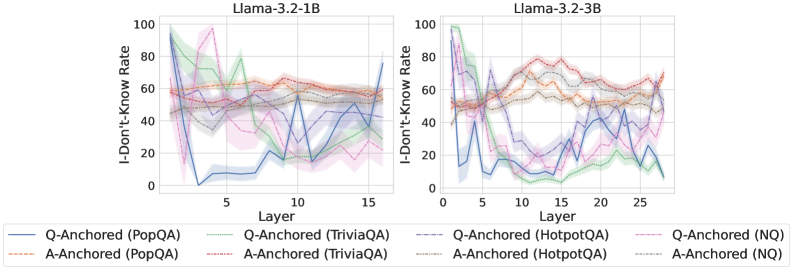
The image contains two line graphs comparing the "I-Don't-Know Rate" (y-axis) across model layers (x-axis) for two versions of the LLaMA-3.2 architecture: **LLaMA-3.2-1B** (left) and **LLaMA-3.2-3B** (right). Each graph includes six data series representing different question-answering (QA) anchoring methods and datasets. The graphs use shaded regions to indicate variability (confidence intervals) around the mean values.
---
### Components/Axes
- **X-Axis (Layer)**:
- Left graph: Layers 0–15 (LLaMA-3.2-1B).
- Right graph: Layers 0–25 (LLaMA-3.2-3B).
- Labels: "Layer" with tick marks at intervals of 5.
- **Y-Axis (I-Don't-Know Rate)**:
- Range: 0–100%.
- Labels: "I-Don't-Know Rate" with increments of 20.
- **Legend**:
- Located at the bottom of both graphs.
- Six data series, differentiated by line style and color:
1. **Q-Anchored (PopQA)**: Solid blue.
2. **A-Anchored (PopQA)**: Dashed orange.
3. **Q-Anchored (TriviaQA)**: Solid green.
4. **A-Anchored (TriviaQA)**: Dashed brown.
5. **Q-Anchored (HotpotQA)**: Solid purple.
6. **Q-Anchored (NQ)**: Dashed pink.
7. **A-Anchored (HotpotQA)**: Dashed gray.
8. **A-Anchored (NQ)**: Dotted gray.
---
### Detailed Analysis
#### Left Graph (LLaMA-3.2-1B)
- **Q-Anchored (PopQA)**:
- Starts at ~90% in layer 0, drops sharply to ~10% by layer 5, then fluctuates between 10–30%.
- **A-Anchored (PopQA)**:
- Starts at ~60%, remains relatively stable (~50–70%) with minor peaks.
- **Q-Anchored (TriviaQA)**:
- Begins at ~80%, dips to ~20% by layer 5, then rises to ~60% by layer 15.
- **A-Anchored (TriviaQA)**:
- Starts at ~50%, fluctuates between 40–60%.
- **Q-Anchored (HotpotQA)**:
- Starts at ~70%, drops to ~30% by layer 5, then rises to ~50% by layer 15.
- **Q-Anchored (NQ)**:
- Starts at ~60%, dips to ~20% by layer 5, then rises to ~40% by layer 15.
- **A-Anchored (HotpotQA)**:
- Starts at ~50%, fluctuates between 40–60%.
- **A-Anchored (NQ)**:
- Starts at ~40%, fluctuates between 30–50%.
#### Right Graph (LLaMA-3.2-3B)
- **Q-Anchored (PopQA)**:
- Starts at ~80%, drops to ~20% by layer 5, then fluctuates between 10–40%.
- **A-Anchored (PopQA)**:
- Starts at ~60%, remains stable (~50–70%) with minor peaks.
- **Q-Anchored (TriviaQA)**:
- Begins at ~80%, dips to ~10% by layer 5, then rises to ~70% by layer 25.
- **A-Anchored (TriviaQA)**:
- Starts at ~50%, fluctuates between 40–60%.
- **Q-Anchored (HotpotQA)**:
- Starts at ~70%, drops to ~20% by layer 5, then rises to ~60% by layer 25.
- **Q-Anchored (NQ)**:
- Starts at ~60%, dips to ~10% by layer 5, then rises to ~50% by layer 25.
- **A-Anchored (HotpotQA)**:
- Starts at ~50%, fluctuates between 40–60%.
- **A-Anchored (NQ)**:
- Starts at ~40%, fluctuates between 30–50%.
---
### Key Observations
1. **Layer-Specific Variability**:
- Both models show significant fluctuations in I-Don't-Know rates, particularly in layers 5–15 (1B) and 10–20 (3B).
- The 3B model exhibits more pronounced volatility, especially in layers 20–25.
2. **Dataset-Specific Trends**:
- **PopQA** (solid blue/orange lines) generally shows lower rates in early layers but stabilizes later.
- **TriviaQA** (solid green/brown lines) has sharp drops in early layers, followed by recovery.
- **HotpotQA** (solid purple/dashed gray lines) exhibits the most dramatic early-layer drops.
- **NQ** (dashed pink/dotted gray lines) consistently shows lower rates but with occasional spikes.
3. **Model Size Impact**:
- The 3B model’s lines are more erratic, suggesting increased sensitivity to layer-specific factors.
---
### Interpretation
The data suggests that anchoring methods and datasets significantly influence the model’s uncertainty across layers. Early layers (0–5) show high I-Don't-Know rates for most methods, likely due to insufficient contextual understanding. Later layers demonstrate recovery, but the 3B model’s larger size introduces greater variability, possibly reflecting architectural complexity. Methods like **Q-Anchored (HotpotQA)** and **A-Anchored (NQ)** appear more stable, indicating robustness in handling uncertainty. The spikes in the 3B model (e.g., layer 20 for Q-Anchored HotpotQA) may highlight critical layers where the model struggles with specific datasets. This analysis underscores the importance of dataset choice and anchoring strategy in mitigating uncertainty in large language models.