## Diagram: Directed Acyclic Graph
### Overview
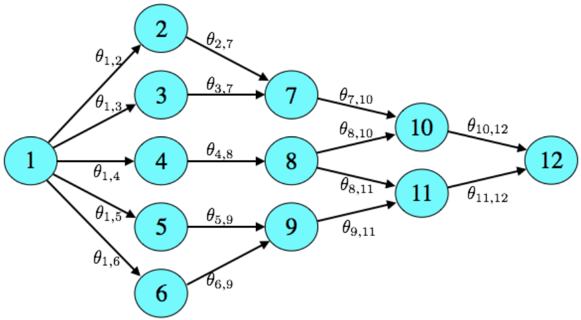
The image depicts a directed acyclic graph (DAG) with 12 nodes, numbered 1 through 12. The nodes are represented as light blue circles, and the directed edges are represented as black arrows. Each edge is labeled with a theta value, denoted as θ followed by the source and destination node numbers. The graph starts with node 1, which branches out to nodes 2, 3, 4, 5, and 6. These nodes then connect to nodes 7, 8, 9, 10, 11, and finally converge at node 12.
### Components/Axes
* **Nodes:** 1, 2, 3, 4, 5, 6, 7, 8, 9, 10, 11, 12 (represented as light blue circles)
* **Edges:** Directed arrows connecting the nodes. Each edge is labeled with a theta value.
* **Edge Labels:** θ<sub>source, destination</sub> (e.g., θ<sub>1,2</sub>, θ<sub>2,7</sub>)
### Detailed Analysis or Content Details
* **Node 1** has outgoing edges to nodes 2, 3, 4, 5, and 6. The corresponding edge labels are θ<sub>1,2</sub>, θ<sub>1,3</sub>, θ<sub>1,4</sub>, θ<sub>1,5</sub>, and θ<sub>1,6</sub>.
* **Node 2** has an outgoing edge to node 7, labeled θ<sub>2,7</sub>.
* **Node 3** has an outgoing edge to node 7, labeled θ<sub>3,7</sub>.
* **Node 4** has an outgoing edge to node 8, labeled θ<sub>4,8</sub>.
* **Node 5** has an outgoing edge to node 9, labeled θ<sub>5,9</sub>.
* **Node 6** has an outgoing edge to node 9, labeled θ<sub>6,9</sub>.
* **Node 7** has an outgoing edge to node 10, labeled θ<sub>7,10</sub>.
* **Node 8** has outgoing edges to nodes 10 and 11, labeled θ<sub>8,10</sub> and θ<sub>8,11</sub>.
* **Node 9** has an outgoing edge to node 11, labeled θ<sub>9,11</sub>.
* **Node 10** has an outgoing edge to node 12, labeled θ<sub>10,12</sub>.
* **Node 11** has an outgoing edge to node 12, labeled θ<sub>11,12</sub>.
* **Node 12** has no outgoing edges.
### Key Observations
* The graph starts with a single node (1) and ends with a single node (12).
* The graph branches out from node 1 and converges at node 12.
* Nodes 7, 8, 9, 10, and 11 have multiple incoming edges.
* The graph is acyclic, meaning there are no cycles or loops.
### Interpretation
The diagram represents a directed acyclic graph, which is a common structure used in various fields such as computer science, project management, and decision-making. The nodes can represent tasks, events, or states, and the edges represent dependencies or relationships between them. The theta values associated with the edges could represent weights, probabilities, or costs associated with traversing those edges. The graph illustrates a process that starts with a single initial state (node 1), branches into multiple parallel paths, and eventually converges to a final state (node 12). The specific meaning of the graph depends on the context in which it is used.