## Directed Graph Diagram: Node Connections with Theta Parameters
### Overview
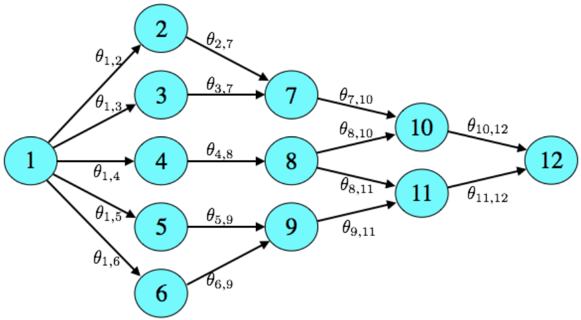
The image depicts a directed acyclic graph (DAG) with 12 nodes labeled 1–12. Nodes are connected via directed edges labeled with theta (θ) parameters (e.g., θ_1,2, θ_2,7). The graph has a hierarchical structure originating from node 1, branching into multiple paths that converge at terminal nodes 10, 11, and 12. All nodes are blue circles with black text labels, and edges are black arrows with theta symbols.
### Components/Axes
- **Nodes**: 12 blue circular nodes labeled 1–12. Node 1 is the root; nodes 10, 11, and 12 are terminal (no outgoing edges).
- **Edges**: 14 directed edges with theta parameters (θ_i,j), where i is the source node and j is the target node. Edges are black arrows with theta symbols in black text.
- **Flow Direction**: All edges point from lower-numbered nodes to higher-numbered nodes, except for θ_8,11 (node 8 → 11) and θ_9,11 (node 9 → 11), which deviate from sequential numbering.
### Detailed Analysis
#### Node Connections and Theta Values
1. **Root Node (1)**:
- Connects to nodes 2, 3, 4, 5, 6 via θ_1,2, θ_1,3, θ_1,4, θ_1,5, θ_1,6.
2. **Intermediate Nodes**:
- Node 2 → 7 (θ_2,7)
- Node 3 → 7 (θ_3,7)
- Node 4 → 8 (θ_4,8)
- Node 5 → 9 (θ_5,9)
- Node 6 → 9 (θ_6,9)
3. **Second-Level Branches**:
- Node 7 → 10 (θ_7,10)
- Node 8 → 10 (θ_8,10), Node 8 → 11 (θ_8,11)
- Node 9 → 11 (θ_9,11)
4. **Terminal Nodes**:
- Node 10 → 12 (θ_10,12)
- Node 11 → 12 (θ_11,12)
#### Spatial Grounding
- **Legend**: No explicit legend present. Node colors (blue) and edge colors (black) are uniform.
- **Text Placement**: Node labels are centered within circles; theta labels are positioned along edge arrows.
### Key Observations
1. **Multiple Paths to Terminal Nodes**:
- Node 12 has two incoming edges (from 10 and 11).
- Node 11 has two incoming edges (from 8 and 9).
2. **Theta Parameter Distribution**:
- Theta values are unique per edge, with no repeated labels.
- Parameters follow a sequential naming convention (θ_i,j) based on source/target nodes.
3. **Structural Symmetry**:
- Nodes 7, 8, 9 act as intermediaries between root branches and terminal nodes.
- Nodes 10 and 11 serve as gateways to the final node (12).
### Interpretation
This graph likely represents a probabilistic or decision-making model where:
- **Node 1** is the initial state or input.
- **Theta parameters (θ_i,j)** quantify relationships (e.g., transition probabilities, weights) between states.
- **Terminal nodes (10, 11, 12)** represent final outcomes or states.
- The graph’s structure suggests dependencies where earlier nodes influence later ones, with node 12 aggregating inputs from multiple paths. The presence of θ_8,11 and θ_9,11 indicates cross-connections between branches, potentially modeling feedback or alternative routes in a system. The absence of cycles confirms it is a DAG, ensuring no infinite loops in traversal.