## Line Chart: Accuracy vs. Total Tokens (Average Per Question)
### Overview
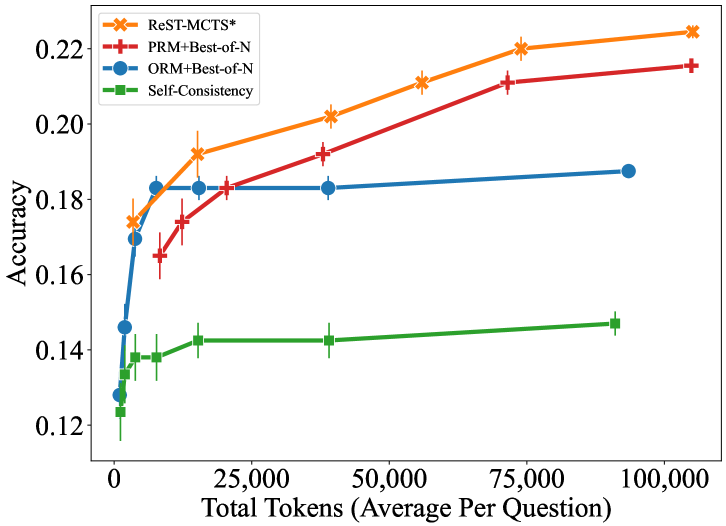
The image is a line chart comparing the accuracy of four different methods (ReST-MCTS*, PRM+Best-of-N, ORM+Best-of-N, and Self-Consistency) as a function of the total number of tokens (averaged per question). The x-axis represents the total tokens, and the y-axis represents the accuracy. Error bars are present on each data point.
### Components/Axes
* **X-axis:** Total Tokens (Average Per Question)
* Scale: 0 to 100,000
* Markers: 0, 25,000, 50,000, 75,000, 100,000
* **Y-axis:** Accuracy
* Scale: 0.12 to 0.22
* Markers: 0.12, 0.14, 0.16, 0.18, 0.20, 0.22
* **Legend (Top-Left):**
* Orange line with 'x' markers: ReST-MCTS*
* Red line with '+' markers: PRM+Best-of-N
* Blue line with circle markers: ORM+Best-of-N
* Green line with square markers: Self-Consistency
### Detailed Analysis
* **ReST-MCTS* (Orange, 'x' markers):** The line starts at approximately (2000, 0.175) and slopes upward, reaching approximately (100000, 0.225).
* (2000, 0.175 +/- 0.005)
* (12500, 0.192 +/- 0.005)
* (40000, 0.203 +/- 0.005)
* (75000, 0.220 +/- 0.005)
* (100000, 0.225 +/- 0.005)
* **PRM+Best-of-N (Red, '+' markers):** The line starts at approximately (2000, 0.170) and slopes upward, reaching approximately (100000, 0.215).
* (2000, 0.170 +/- 0.010)
* (12500, 0.182 +/- 0.010)
* (40000, 0.195 +/- 0.010)
* (75000, 0.210 +/- 0.010)
* (100000, 0.215 +/- 0.010)
* **ORM+Best-of-N (Blue, circle markers):** The line starts at approximately (2000, 0.145) and rises sharply to approximately (12500, 0.183), then remains relatively flat, ending at approximately (100000, 0.188).
* (2000, 0.145 +/- 0.005)
* (12500, 0.183 +/- 0.005)
* (40000, 0.183 +/- 0.005)
* (75000, 0.185 +/- 0.005)
* (100000, 0.188 +/- 0.005)
* **Self-Consistency (Green, square markers):** The line starts at approximately (2000, 0.130) and rises slightly, ending at approximately (100000, 0.148).
* (2000, 0.130 +/- 0.010)
* (5000, 0.135 +/- 0.010)
* (12500, 0.142 +/- 0.010)
* (40000, 0.143 +/- 0.010)
* (100000, 0.148 +/- 0.010)
### Key Observations
* ReST-MCTS* consistently outperforms the other methods across all token counts.
* PRM+Best-of-N performs similarly to ReST-MCTS*, but with slightly lower accuracy.
* ORM+Best-of-N shows a rapid increase in accuracy initially, but plateaus quickly.
* Self-Consistency has the lowest accuracy and shows minimal improvement with increasing token count.
* The error bars appear to be larger for PRM+Best-of-N and Self-Consistency, indicating greater variability in their performance.
### Interpretation
The chart demonstrates the relationship between the number of tokens used (averaged per question) and the accuracy of four different methods. ReST-MCTS* and PRM+Best-of-N show the most significant improvement in accuracy as the number of tokens increases, suggesting that these methods benefit more from increased context or complexity. ORM+Best-of-N plateaus quickly, indicating that it may not be as effective at utilizing additional tokens. Self-Consistency consistently performs the worst, suggesting it is the least effective method for this task, regardless of the number of tokens used. The error bars provide insight into the stability and reliability of each method, with larger error bars indicating greater variability in performance.