## Line Chart: Accuracy vs. Total Tokens (Average Per Question)
### Overview
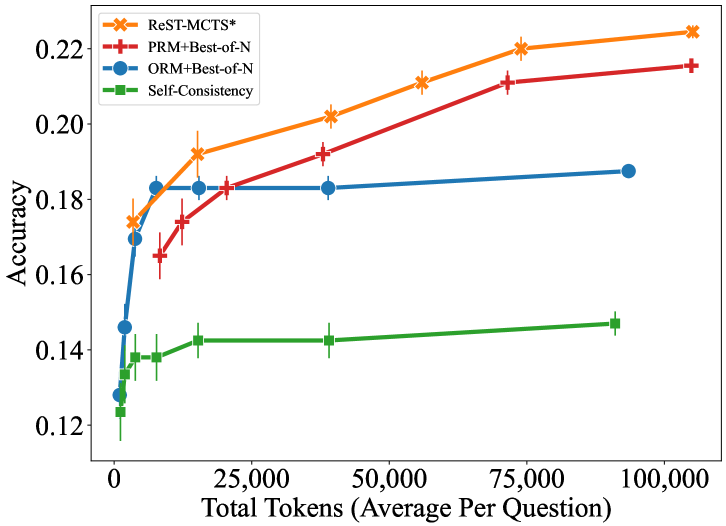
This image is a line chart comparing the performance (Accuracy) of four different inference methods against the computational cost (Total Tokens used per question). The chart demonstrates how accuracy scales as the number of tokens increases for each method.
### Components/Axes
* **Y-Axis (Vertical):** Labeled "Accuracy". The scale ranges from 0.12 to 0.22, with major grid lines at intervals of 0.02.
* **X-Axis (Horizontal):** Labeled "Total Tokens (Average Per Question)". The scale ranges from 0 to 100,000, with major grid lines at intervals of 25,000.
* **Legend:** Located in the top-left corner of the chart area.
* **Orange (X marker):** ReST-MCTS*
* **Red (+ marker):** PRM+Best-of-N
* **Blue (Circle marker):** ORM+Best-of-N
* **Green (Square marker):** Self-Consistency
### Detailed Analysis
#### 1. ReST-MCTS* (Orange, X marker)
* **Trend:** This series shows a consistent, steady upward slope across the entire X-axis range. It does not appear to plateau within the observed range.
* **Data Points (Approximate):**
* ~2,000 tokens: ~0.174 accuracy
* ~15,000 tokens: ~0.192 accuracy
* ~40,000 tokens: ~0.202 accuracy
* ~75,000 tokens: ~0.220 accuracy
* ~105,000 tokens: ~0.225 accuracy
#### 2. PRM+Best-of-N (Red, + marker)
* **Trend:** This series shows a steady upward slope, closely trailing the ReST-MCTS* line. It maintains a consistent positive trajectory.
* **Data Points (Approximate):**
* ~10,000 tokens: ~0.165 accuracy
* ~13,000 tokens: ~0.174 accuracy
* ~20,000 tokens: ~0.183 accuracy
* ~40,000 tokens: ~0.192 accuracy
* ~75,000 tokens: ~0.212 accuracy
* ~105,000 tokens: ~0.216 accuracy
#### 3. ORM+Best-of-N (Blue, Circle marker)
* **Trend:** This series exhibits a sharp, steep increase in accuracy at very low token counts (0 to ~8,000 tokens). After ~8,000 tokens, the line flattens significantly, indicating a plateau or diminishing returns.
* **Data Points (Approximate):**
* ~1,500 tokens: ~0.128 accuracy
* ~2,000 tokens: ~0.146 accuracy
* ~4,000 tokens: ~0.170 accuracy
* ~8,000 tokens: ~0.183 accuracy
* ~18,000 tokens: ~0.183 accuracy
* ~40,000 tokens: ~0.183 accuracy
* ~95,000 tokens: ~0.188 accuracy
#### 4. Self-Consistency (Green, Square marker)
* **Trend:** This series starts at the lowest accuracy point and shows the slowest growth rate. It exhibits a slight upward trend but remains largely flat compared to the other methods.
* **Data Points (Approximate):**
* ~1,500 tokens: ~0.124 accuracy
* ~2,000 tokens: ~0.134 accuracy
* ~4,000 tokens: ~0.138 accuracy
* ~9,000 tokens: ~0.138 accuracy
* ~18,000 tokens: ~0.142 accuracy
* ~40,000 tokens: ~0.142 accuracy
* ~95,000 tokens: ~0.147 accuracy
### Key Observations
* **Performance Hierarchy:** ReST-MCTS* consistently outperforms the other methods at higher token counts.
* **Diminishing Returns:** Both ORM+Best-of-N and Self-Consistency exhibit clear "plateaus" where increasing the token count yields negligible improvements in accuracy.
* **Error Bars:** Vertical error bars are present on most data points, indicating variance or uncertainty in the measurements. The error bars are generally consistent in size across the series, though they appear slightly larger at lower token counts for some series.
* **Scaling Efficiency:** ReST-MCTS* and PRM+Best-of-N demonstrate better scalability, as their accuracy continues to climb as more tokens are allocated, whereas ORM and Self-Consistency appear to hit a ceiling early.
### Interpretation
The data suggests that for the task being measured, methods utilizing Process Reward Models (PRM) or MCTS (Monte Carlo Tree Search) scaling (ReST-MCTS*) are significantly more effective at utilizing increased computational resources (tokens) than Outcome Reward Models (ORM) or standard Self-Consistency.
The ORM+Best-of-N method is highly efficient at very low token counts but fails to improve significantly beyond ~10,000 tokens, suggesting that the model's ability to distinguish correct from incorrect outcomes is limited by the model's inherent capabilities rather than just the number of samples. Conversely, the ReST-MCTS* method suggests that iterative search and process-based rewards allow the model to continue finding better solutions as it is granted more computational "thinking time" (tokens).