\n
## Line Chart: Accuracy vs. Total Tokens (Average Per Question)
### Overview
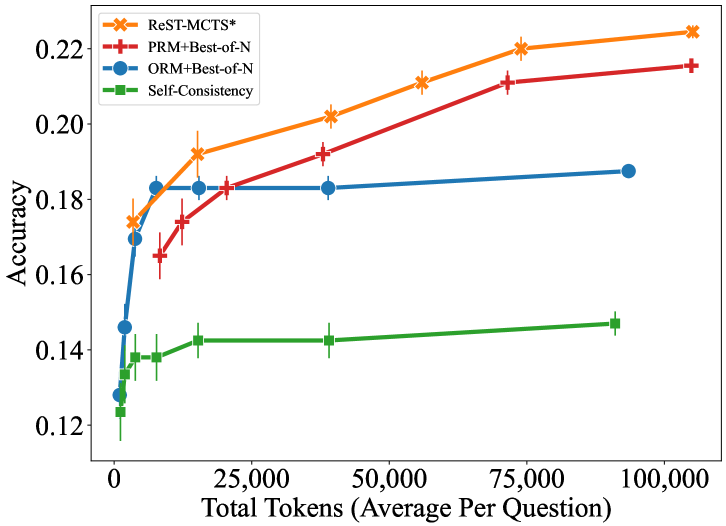
This image is a line chart comparing the performance (accuracy) of four different computational methods or models as a function of the average number of tokens used per question. The chart demonstrates how accuracy scales with increased computational effort (token usage) for each method.
### Components/Axes
* **Chart Type:** Line chart with error bars.
* **X-Axis:**
* **Label:** "Total Tokens (Average Per Question)"
* **Scale:** Linear, ranging from 0 to 100,000.
* **Major Tick Marks:** 0, 25,000, 50,000, 75,000, 100,000.
* **Y-Axis:**
* **Label:** "Accuracy"
* **Scale:** Linear, ranging from approximately 0.12 to 0.22.
* **Major Tick Marks:** 0.12, 0.14, 0.16, 0.18, 0.20, 0.22.
* **Legend:** Located in the top-left corner of the plot area. It defines four data series:
1. **ReST-MCTS\***: Orange line with star (`*`) markers.
2. **PRM+Best-of-N**: Red line with plus (`+`) markers.
3. **ORM+Best-of-N**: Blue line with circle (`●`) markers.
4. **Self-Consistency**: Green line with square (`■`) markers.
### Detailed Analysis
The chart plots four distinct data series. Each point includes vertical error bars, indicating variability or confidence intervals around the accuracy measurement.
**1. ReST-MCTS\* (Orange, Star Markers)**
* **Trend:** Shows a strong, consistent upward trend. Accuracy increases steeply at low token counts and continues to rise steadily across the entire range.
* **Approximate Data Points:**
* ~0 tokens: Accuracy ~0.125
* ~5,000 tokens: Accuracy ~0.175
* ~15,000 tokens: Accuracy ~0.192
* ~40,000 tokens: Accuracy ~0.202
* ~60,000 tokens: Accuracy ~0.210
* ~75,000 tokens: Accuracy ~0.220
* ~105,000 tokens: Accuracy ~0.225 (highest point on the chart)
**2. PRM+Best-of-N (Red, Plus Markers)**
* **Trend:** Also shows a strong upward trend, closely following but slightly below the ReST-MCTS* line. The rate of improvement is similar.
* **Approximate Data Points:**
* ~5,000 tokens: Accuracy ~0.165
* ~10,000 tokens: Accuracy ~0.175
* ~20,000 tokens: Accuracy ~0.183
* ~40,000 tokens: Accuracy ~0.192
* ~75,000 tokens: Accuracy ~0.210
* ~105,000 tokens: Accuracy ~0.215
**3. ORM+Best-of-N (Blue, Circle Markers)**
* **Trend:** Shows a rapid initial increase in accuracy at very low token counts, then plateaus sharply. After approximately 10,000 tokens, the accuracy remains nearly flat, showing minimal gain from additional tokens.
* **Approximate Data Points:**
* ~0 tokens: Accuracy ~0.125
* ~2,500 tokens: Accuracy ~0.145
* ~5,000 tokens: Accuracy ~0.170
* ~10,000 tokens: Accuracy ~0.182 (plateau begins)
* ~15,000 tokens: Accuracy ~0.182
* ~40,000 tokens: Accuracy ~0.182
* ~90,000 tokens: Accuracy ~0.188
**4. Self-Consistency (Green, Square Markers)**
* **Trend:** Shows a modest, gradual upward trend. It starts at a similar accuracy to the others at 0 tokens but improves at a much slower rate. It remains the lowest-performing method across the entire range.
* **Approximate Data Points:**
* ~0 tokens: Accuracy ~0.125
* ~2,500 tokens: Accuracy ~0.135
* ~5,000 tokens: Accuracy ~0.138
* ~15,000 tokens: Accuracy ~0.142
* ~40,000 tokens: Accuracy ~0.142
* ~90,000 tokens: Accuracy ~0.148
### Key Observations
1. **Performance Hierarchy:** There is a clear and consistent performance hierarchy across most of the token range: ReST-MCTS* > PRM+Best-of-N > ORM+Best-of-N > Self-Consistency.
2. **Scaling Behavior:** ReST-MCTS* and PRM+Best-of-N demonstrate favorable scaling properties, with accuracy continuing to improve significantly as more tokens are allocated. ORM+Best-of-N exhibits a "diminishing returns" pattern, saturating early. Self-Consistency scales poorly.
3. **Initial Convergence:** All methods start at a very similar accuracy level (~0.125) with near-zero token usage, suggesting a common baseline.
4. **Error Bars:** The error bars appear relatively consistent in size for each series, suggesting stable variance in the measurements. They do not overlap between the top two methods (ReST-MCTS* and PRM+Best-of-N) and the bottom two (ORM+Best-of-N and Self-Consistency) at higher token counts, indicating statistically distinct performance.
### Interpretation
This chart likely comes from research on reasoning or problem-solving with large language models, where "tokens" represent computational effort (e.g., steps in a reasoning chain, samples generated).
* **What the data suggests:** The data demonstrates that the **ReST-MCTS\*** method is the most effective and efficient at converting increased computational budget (tokens) into higher accuracy. It outperforms the other methods, especially at higher token budgets. **PRM+Best-of-N** is a close second.
* **Relationship between elements:** The chart directly compares algorithmic strategies. The stark difference between the plateau of **ORM+Best-of-N** and the continued rise of **ReST-MCTS\*** suggests a fundamental advantage in the latter's approach to utilizing additional computation. **Self-Consistency**, while improving, is a less token-efficient strategy.
* **Notable implications:** The results argue for the use of methods like ReST-MCTS* when high accuracy is critical and computational resources (token budget) are available. The early plateau of ORM+Best-of-N indicates it may be a good choice for low-latency applications where token usage must be minimized, but it is not suitable for pushing accuracy to its limits. The chart provides a clear empirical basis for selecting a method based on the available token budget and desired accuracy target.