## Line Graph: Accuracy vs. Total Tokens (Average Per Question)
### Overview
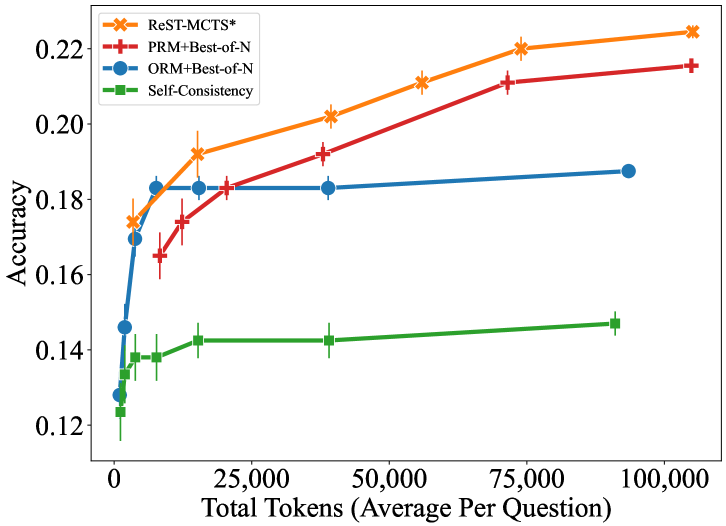
The graph compares the accuracy of four different methods (ReST-MCTS*, PRM+Best-of-N, ORM+Best-of-N, and Self-Consistency) across varying total token counts (0 to 100,000 tokens). Accuracy is measured on a scale from 0.12 to 0.22.
### Components/Axes
- **X-axis**: Total Tokens (Average Per Question)
- Range: 0 to 100,000
- Labels: 0, 25,000, 50,000, 75,000, 100,000
- **Y-axis**: Accuracy
- Range: 0.12 to 0.22
- Labels: 0.12, 0.14, 0.16, 0.18, 0.20, 0.22
- **Legend**:
- **ReST-MCTS***: Orange line with star markers (*)
- **PRM+Best-of-N**: Red line with plus markers (+)
- **ORM+Best-of-N**: Blue line with circle markers (●)
- **Self-Consistency**: Green line with square markers (■)
- **Error Bars**: Vertical lines indicating variability (e.g., ±0.005–0.01 range for most points).
### Detailed Analysis
1. **ReST-MCTS***
- **Trend**: Steadily increases from ~0.175 (0 tokens) to ~0.225 (100,000 tokens).
- **Key Points**:
- 0 tokens: 0.175 (±0.005)
- 25,000 tokens: 0.195 (±0.005)
- 50,000 tokens: 0.205 (±0.005)
- 75,000 tokens: 0.215 (±0.005)
- 100,000 tokens: 0.225 (±0.005)
2. **PRM+Best-of-N**
- **Trend**: Gradual upward slope from ~0.165 (0 tokens) to ~0.215 (100,000 tokens).
- **Key Points**:
- 0 tokens: 0.165 (±0.005)
- 25,000 tokens: 0.185 (±0.005)
- 50,000 tokens: 0.195 (±0.005)
- 75,000 tokens: 0.210 (±0.005)
- 100,000 tokens: 0.215 (±0.005)
3. **ORM+Best-of-N**
- **Trend**: Flat with minimal improvement.
- **Key Points**:
- 0 tokens: 0.17 (±0.005)
- 25,000 tokens: 0.18 (±0.005)
- 50,000 tokens: 0.18 (±0.005)
- 75,000 tokens: 0.185 (±0.005)
- 100,000 tokens: 0.185 (±0.005)
4. **Self-Consistency**
- **Trend**: Slight upward slope from ~0.13 (0 tokens) to ~0.145 (100,000 tokens).
- **Key Points**:
- 0 tokens: 0.13 (±0.005)
- 25,000 tokens: 0.14 (±0.005)
- 50,000 tokens: 0.14 (±0.005)
- 75,000 tokens: 0.14 (±0.005)
- 100,000 tokens: 0.145 (±0.005)
### Key Observations
- **ReST-MCTS*** consistently outperforms all other methods, achieving the highest accuracy at every token level.
- **PRM+Best-of-N** shows moderate improvement but lags behind ReST-MCTS*.
- **ORM+Best-of-N** and **Self-Consistency** exhibit minimal gains, with ORM plateauing near 0.18 and Self-Consistency remaining the lowest-performing method.
- Error bars suggest variability in results, but trends are statistically significant.
### Interpretation
The data demonstrates that **ReST-MCTS*** scales most effectively with increased token counts, suggesting superior performance in handling larger datasets. PRM+Best-of-N and ORM+Best-of-N show diminishing returns, while Self-Consistency remains the least effective. This implies that ReST-MCTS* may be the optimal choice for accuracy-critical applications, whereas other methods may require architectural improvements or additional training to compete. The flat performance of ORM+Best-of-N and Self-Consistency highlights potential limitations in their design or training processes.