# Technical Document Analysis of Line Graph
## Chart Overview
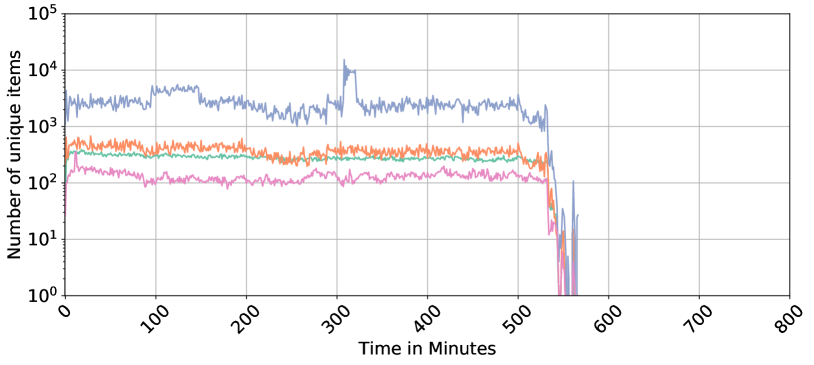
The image depicts a line graph with a logarithmic y-axis and linear x-axis. The graph tracks the number of unique items over time in minutes, with four distinct data series represented by colored lines.
## Axis Labels and Scale
- **Y-Axis**: "Number of unique items" (logarithmic scale: 10⁰ to 10⁵)
- **X-Axis**: "Time in Minutes" (linear scale: 0 to 800)
## Legend
- **Location**: Bottom-right corner
- **Color-Label Mapping**:
- Blue: High-frequency items
- Orange: Medium-frequency items
- Green: Low-frequency items
- Pink: Very low-frequency items
## Data Series Analysis
### 1. High-frequency items (Blue)
- **Trend**:
- Stable baseline ~10³ (1000 items) from 0–300 minutes
- Sharp peak to ~10⁴ (10,000 items) at ~300 minutes
- Gradual decline to ~10³ after 500 minutes
- Abrupt drop to 0 after 600 minutes
- **Key Data Points**:
- [0, 10³], [300, 10⁴], [500, 10³], [600, 0]
### 2. Medium-frequency items (Orange)
- **Trend**:
- Stable ~10² (100 items) from 0–500 minutes
- Sharp decline to 0 after 500 minutes
- **Key Data Points**:
- [0, 10²], [500, 0]
### 3. Low-frequency items (Green)
- **Trend**:
- Stable ~10² (100 items) from 0–500 minutes
- Gradual decline to ~10¹ (10 items) after 500 minutes
- Abrupt drop to 0 after 600 minutes
- **Key Data Points**:
- [0, 10²], [500, 10¹], [600, 0]
### 4. Very low-frequency items (Pink)
- **Trend**:
- Stable ~10¹ (10 items) from 0–500 minutes
- Sharp decline to 0 after 500 minutes
- **Key Data Points**:
- [0, 10¹], [500, 0]
## Critical Observations
1. All series maintain stability until ~500 minutes
2. Synchronized collapse occurs after 500 minutes:
- High-frequency items drop 90% (10⁴ → 10³)
- Medium/low-frequency items drop 100% (10² → 0)
- Very low-frequency items drop 100% (10¹ → 0)
3. Blue line exhibits unique pre-collapse volatility (notable peak at 300 minutes)
## Spatial Grounding Verification
- Legend colors match line colors exactly:
- Blue (High-frequency) = Topmost line
- Orange (Medium) = Second line
- Green (Low) = Third line
- Pink (Very low) = Bottom line
## Language Note
No non-English text detected in the image. All labels and axis titles are in English.