## Diagram: Intersections of Ellipsoids
### Overview
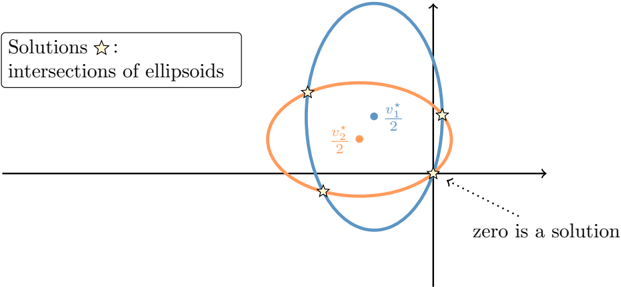
This image is a 2D geometric diagram plotted on a Cartesian coordinate system. It illustrates the intersection of two ellipses (referred to as "ellipsoids" in the text) centered at different points in the first quadrant. The diagram highlights the intersection points as solutions to a system of equations.
### Components/Axes
* **Axes:** A standard black Cartesian coordinate system (horizontal x-axis, vertical y-axis) intersecting at the origin (0,0).
* **Blue Ellipse:** A vertically elongated ellipse. Its center is marked with a blue dot labeled $v_1^*/2$.
* **Orange Ellipse:** A horizontally elongated ellipse. Its center is marked with an orange dot labeled $v_2^*/2$.
* **Intersection Markers:** Four yellow stars ($\star$) are placed at the points where the boundaries of the blue and orange ellipses cross.
* **Text Labels:**
* **Top-Left Box:** "Solutions $\star$: intersections of ellipsoids"
* **Bottom-Right:** "zero is a solution" (accompanied by a dotted arrow pointing to the intersection point at the origin).
### Detailed Analysis
* **Spatial Positioning:**
* **Centers:** Both ellipses are centered in the first quadrant (positive x, positive y). The blue center ($v_1^*/2$) is positioned higher and slightly to the right of the orange center ($v_2^*/2$).
* **Blue Ellipse:** This shape is tall and narrow, extending vertically along the y-axis.
* **Orange Ellipse:** This shape is wide and flat, extending horizontally along the x-axis.
* **Intersection Points:**
* **Origin (0,0):** One of the four intersection points is located exactly at the origin. This is explicitly identified by the text "zero is a solution."
* **Other Intersections:** There are three other intersection points:
1. **Upper-Left:** Located in the second quadrant (negative x, positive y).
2. **Right-Side:** Located in the first quadrant (positive x, positive y).
3. **Bottom-Left:** Located in the third quadrant (negative x, negative y).
* *Note:* The visual representation suggests the ellipses are not perfectly centered on the axes, but their intersection points span across the origin and into adjacent quadrants.
### Key Observations
* **Origin as a Solution:** The diagram explicitly calls out that the origin $(0,0)$ is a solution. This implies that the quadratic equations defining these ellipses have a constant term of zero.
* **Terminology:** While the text refers to them as "ellipsoids," the diagram is a 2D representation (ellipses). This suggests the diagram is a cross-section or a projection of a higher-dimensional problem.
* **Notation:** The centers are labeled $v_1^*/2$ and $v_2^*/2$. The use of the asterisk ($*$) and the division by 2 is common in optimization theory, control theory, or vector calculus, often representing optimal values or midpoints of vectors.
### Interpretation
This diagram represents the solution set for a system of two quadratic equations in two variables.
* **Mathematical Context:** The intersection points (marked by stars) represent the coordinate pairs $(x, y)$ that satisfy both quadratic equations simultaneously.
* **Why it matters:** In optimization or control theory, such diagrams are often used to visualize the feasible region or the set of points satisfying optimality conditions (like KKT conditions). The fact that the origin is a solution indicates that the system is homogeneous or has been shifted such that the trivial solution $(0,0)$ is valid.
* **Reading between the lines:** The notation $v^*/2$ suggests that the centers of these ellipses are derived from specific vectors $v_1^*$ and $v_2^*$. The diagram demonstrates that even when two quadratic forms are centered at different locations, they can intersect at multiple points, including the origin, depending on their orientation and eccentricity.