## Bar Chart: Reflection Frequency Before and After GRPO
### Overview
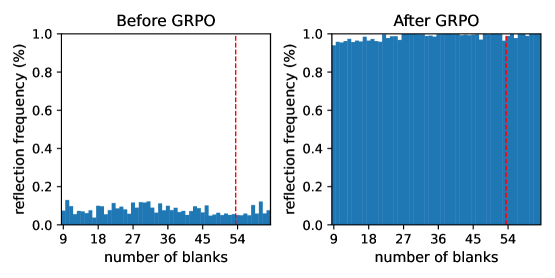
The image presents two bar charts side-by-side, comparing the reflection frequency (%) against the number of blanks "Before GRPO" and "After GRPO". Both charts share the same x and y axes. A vertical dashed red line is present at x=54 on both charts. The "Before GRPO" chart shows low reflection frequencies, while the "After GRPO" chart shows significantly higher reflection frequencies.
### Components/Axes
* **Titles:**
* Left Chart: "Before GRPO"
* Right Chart: "After GRPO"
* **Y-axis (Reflection Frequency (%)):**
* Label: "reflection frequency (%)"
* Scale: 0.0 to 1.0, with increments of 0.2 (0.0, 0.2, 0.4, 0.6, 0.8, 1.0)
* **X-axis (Number of Blanks):**
* Label: "number of blanks"
* Scale: 9 to 54, with increments of 9 (9, 18, 27, 36, 45, 54)
* **Bars:** Blue bars represent the reflection frequency for each number of blanks.
* **Vertical Line:** A dashed red vertical line is present at the x=54 position on both charts.
### Detailed Analysis
**Left Chart: Before GRPO**
* The reflection frequency is generally low, mostly below 0.2.
* The bars fluctuate, indicating some variation in reflection frequency across different numbers of blanks.
* Specific values are difficult to extract precisely due to the bar chart format, but the reflection frequency appears to range from approximately 0.05 to 0.15.
**Right Chart: After GRPO**
* The reflection frequency is significantly higher compared to the "Before GRPO" chart, mostly above 0.9.
* The bars are consistently high, indicating a more uniform reflection frequency across different numbers of blanks.
* Specific values are difficult to extract precisely, but the reflection frequency appears to range from approximately 0.95 to 1.0.
### Key Observations
* **Significant Increase:** The GRPO process leads to a substantial increase in reflection frequency across all numbers of blanks.
* **Uniformity:** The "After GRPO" chart shows a more uniform reflection frequency compared to the "Before GRPO" chart.
* **Vertical Line:** The dashed red line at x=54 is a reference point, possibly indicating a threshold or a specific number of blanks of interest.
### Interpretation
The charts demonstrate the impact of the GRPO process on reflection frequency. Before GRPO, the reflection frequency is low and variable. After GRPO, the reflection frequency is significantly increased and becomes more uniform across different numbers of blanks. This suggests that GRPO is an effective process for enhancing reflection properties, leading to more consistent and higher reflection frequencies. The vertical line at x=54 may indicate a critical number of blanks where this enhancement is particularly important.