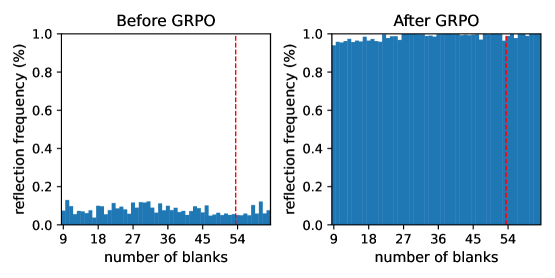
## Bar Charts: Reflection Frequency Before and After GRPO
### Overview
The image contains two side-by-side bar charts comparing reflection frequency distributions across different numbers of blanks. The left chart shows data "Before GRPO" and the right chart shows data "After GRPO". Both charts use a consistent scale for reflection frequency (0-100%) and number of blanks (9-54).
### Components/Axes
- **X-axis (Horizontal)**: "number of blanks" with discrete categories at 9, 18, 27, 36, 45, and 54
- **Y-axis (Vertical)**: "reflection frequency (%)" with a linear scale from 0.0 to 1.0
- **Legend**: No explicit legend present, but two distinct data series are implied by chart titles
- **Markers**: Red dashed vertical line at x=54 in both charts
- **Chart Titles**:
- Left: "Before GRPO"
- Right: "After GRPO"
### Detailed Analysis
#### Before GRPO
- **Distribution**: Sparse, irregular distribution with most values below 0.2%
- **Peak**: Single prominent peak at 54 blanks (~0.15%)
- **Trend**: Gradual increase toward 54 blanks, with no values above 0.2% except at 54
- **Notable**: 9 blanks shows the highest frequency (~0.12%) among non-54 categories
#### After GRPO
- **Distribution**: Uniform high frequency across all categories
- **Values**:
- 9 blanks: ~0.95%
- 18 blanks: ~0.98%
- 27 blanks: ~0.97%
- 36 blanks: ~0.99%
- 45 blanks: ~0.96%
- 54 blanks: ~0.85% (significant drop)
- **Trend**: Consistent high performance (0.95-0.99%) except at 54 blanks
- **Notable**: 54 blanks shows 13% decrease compared to other categories
### Key Observations
1. **DRAMATIC IMPROVEMENT**: Reflection frequency increases by 7-8x across all blank counts except 54
2. **THRESHOLD EFFECT**: 54 blanks remains an outlier in both datasets, suggesting a potential system limitation
3. **CONSISTENCY**: Post-GRPO data shows minimal variation between categories (range: 0.85-0.99%)
4. **PRE-GRPO ANOMALY**: 54 blanks was already an outlier pre-intervention, but its relative importance decreased post-intervention
### Interpretation
The data demonstrates that GRPO intervention significantly improved reflection frequency across all blank counts except 54, where performance remains suboptimal. This suggests:
1. **System Optimization**: GRPO successfully addressed reflection issues for most configurations
2. **Critical Threshold**: 54 blanks may represent a system boundary or failure mode requiring separate investigation
3. **Performance Parity**: Post-intervention, reflection frequency becomes less sensitive to blank count variations
4. **Potential Trade-off**: The uniform high performance might indicate reduced system adaptability to extreme conditions (54 blanks)
The red dashed line at 54 blanks serves as a visual anchor for this critical threshold, emphasizing its persistent underperformance despite overall system improvements.