## Line Chart: Benchmark Scores by Model Number
### Overview
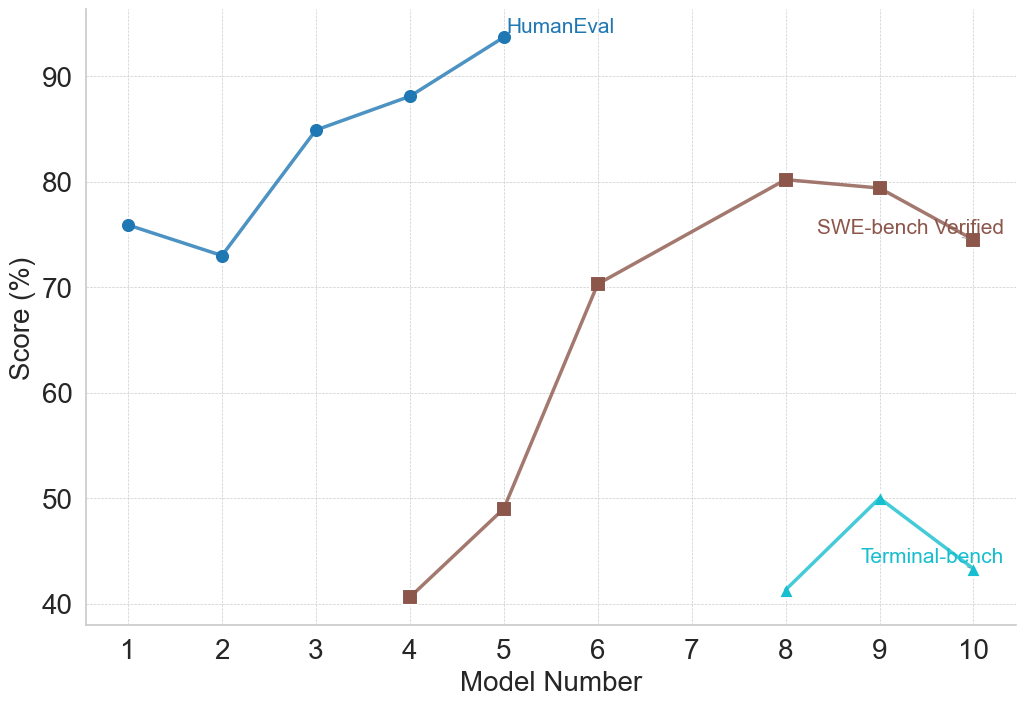
This image is a line chart displaying the performance scores (in percentages) of various models (numbered 1 through 10) across three different evaluation benchmarks: HumanEval, SWE-bench Verified, and Terminal-bench. The chart illustrates how performance evolves across sequential model iterations, with different benchmarks being applied to different subsets of the models.
*Note: All text in this image is in English. No other languages are present.*
### Components/Axes
**Component Isolation:**
* **Left Edge (Y-Axis):** The vertical axis is labeled **"Score (%)"**. The scale ranges from 40 to 90, with major tick marks and corresponding labels at intervals of 10 (40, 50, 60, 70, 80, 90).
* **Bottom Edge (X-Axis):** The horizontal axis is labeled **"Model Number"**. The scale ranges from 1 to 10, with major tick marks and corresponding labels at intervals of 1 (1, 2, 3, 4, 5, 6, 7, 8, 9, 10).
* **Background:** A light gray, dashed grid is present, aligning with the major tick marks on both the X and Y axes to aid in reading values.
* **Main Chart Area:** Contains three distinct data series, differentiated by color, marker shape, and direct text labeling (acting as the legend).
**Data Series Identifiers (Legend/Labels):**
* **HumanEval:** Blue line with solid circular markers. Label is positioned at the top-center, immediately to the right of its final data point.
* **SWE-bench Verified:** Brown line with solid square markers. Label is positioned at the middle-right, just above its final data point.
* **Terminal-bench:** Teal/Cyan line with solid upward-pointing triangular markers. Label is positioned at the bottom-right, intersecting its final line segment.
---
### Detailed Analysis
#### 1. HumanEval Series (Blue Line, Circular Markers)
* **Spatial Grounding:** Located in the top-left to top-center quadrant of the chart. Spans Model Numbers 1 through 5.
* **Trend Verification:** The line begins at a high baseline, dips slightly at model 2, and then exhibits a strong, consistent upward slope through model 5, reaching the highest overall score on the chart.
* **Data Points (Approximate):**
* Model 1: ~76%
* Model 2: ~73%
* Model 3: ~85%
* Model 4: ~88%
* Model 5: ~94%
#### 2. SWE-bench Verified Series (Brown Line, Square Markers)
* **Spatial Grounding:** Located in the center to middle-right area of the chart. Spans Model Numbers 4 through 10, notably skipping Model Number 7.
* **Trend Verification:** The line starts at the lowest point on the chart, rises moderately to model 5, then spikes sharply upward to model 6. It continues to rise to a peak at model 8, plateaus slightly to model 9, and then slopes downward to model 10.
* **Data Points (Approximate):**
* Model 4: ~41%
* Model 5: ~49%
* Model 6: ~70%
* Model 7: *No data point present.*
* Model 8: ~80%
* Model 9: ~79.5%
* Model 10: ~74%
#### 3. Terminal-bench Series (Teal Line, Triangular Markers)
* **Spatial Grounding:** Located in the bottom-right quadrant of the chart. Spans Model Numbers 8 through 10.
* **Trend Verification:** The line forms an inverted "V" shape. It starts low, slopes upward to a peak at model 9, and then slopes downward to model 10.
* **Data Points (Approximate):**
* Model 8: ~41%
* Model 9: ~50%
* Model 10: ~43%
---
### Key Observations
* **Non-Overlapping Domains:** The "HumanEval" benchmark is only recorded for early models (1-5), while "Terminal-bench" is only recorded for late models (8-10). "SWE-bench Verified" bridges the middle and late models (4-10).
* **Missing Data:** There is a distinct gap in the "SWE-bench Verified" data at Model Number 7. The line connects directly from Model 6 to Model 8.
* **Model 10 Regression:** Both benchmarks measured at Model 10 (SWE-bench Verified and Terminal-bench) show a decline in performance compared to Model 9.
* **Scale Differences:** HumanEval scores are significantly higher overall (70s to 90s) compared to the starting points of the other two benchmarks (which begin in the 40s).
---
### Interpretation
This chart likely tracks the evolutionary progress of a specific family of AI models (e.g., a series of Large Language Models) across different coding or agentic benchmarks.
**Reading between the lines:**
1. **Benchmark Saturation:** The "HumanEval" benchmark was likely abandoned after Model 5 because the score reached ~94%. In AI development, once a model effectively "solves" or saturates a benchmark, researchers move on to more difficult tests to accurately gauge further improvements.
2. **Increasing Difficulty:** "SWE-bench Verified" and "Terminal-bench" are clearly much harder evaluations than HumanEval. When SWE-bench is introduced at Model 4, the score is only ~41%, whereas the same model scores ~88% on HumanEval.
3. **The "Model 10" Anomaly:** The consistent drop in performance across multiple benchmarks from Model 9 to Model 10 is highly notable. This suggests that Model 10 might be a smaller, more efficient, or differently optimized model (e.g., a distilled version or a model optimized for speed rather than raw reasoning) rather than a direct, larger successor to Model 9. Alternatively, it represents a failed training run or a regression caused by a change in architecture or training data.
4. **The Missing Model 7:** The absence of data for Model 7 on the SWE-bench line suggests that Model 7 was either an internal experiment that was never fully evaluated on this benchmark, or the evaluation failed/was deemed invalid for that specific iteration.