## Chart: Model Performance Comparison
### Overview
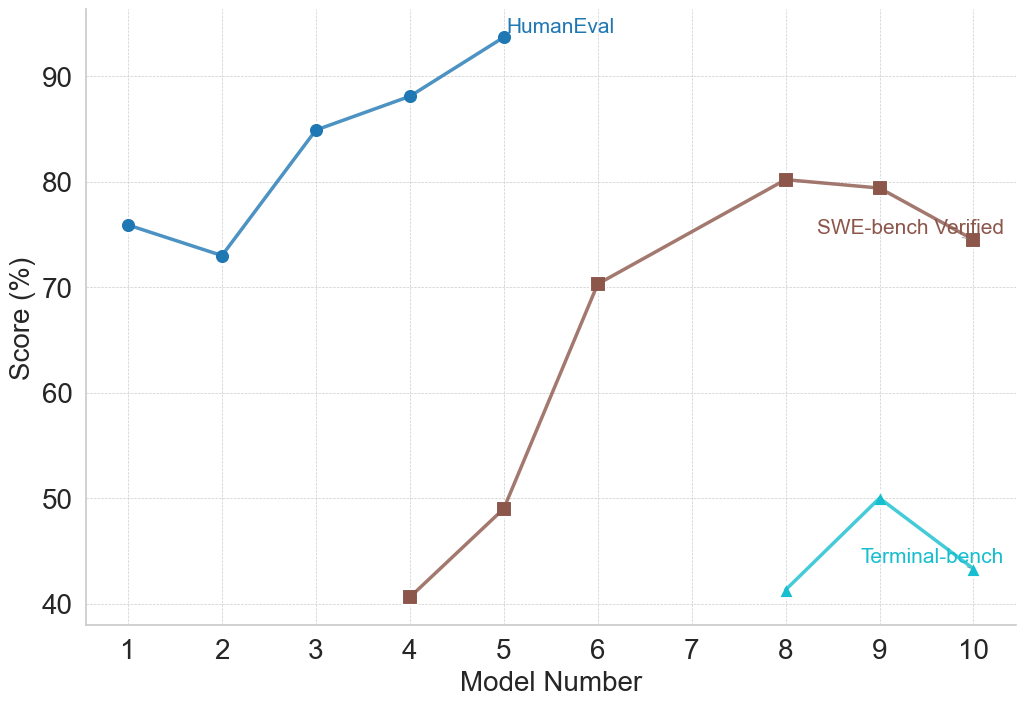
The image is a line chart comparing the performance of different models across three benchmarks: HumanEval, SWE-bench Verified, and Terminal-bench. The x-axis represents the Model Number (from 1 to 10), and the y-axis represents the Score (in percentage). Each benchmark is represented by a different colored line with distinct markers.
### Components/Axes
* **X-axis:** Model Number, ranging from 1 to 10 in increments of 1.
* **Y-axis:** Score (%), ranging from 40 to 90 in increments of 10.
* **Legend:**
* **HumanEval:** Blue line with circle markers. Located at the top of the chart.
* **SWE-bench Verified:** Brown line with square markers. Located in the middle-right of the chart.
* **Terminal-bench:** Cyan line with triangle markers. Located at the bottom-right of the chart.
### Detailed Analysis
* **HumanEval (Blue, Circle Markers):** The line generally slopes upward, indicating increasing performance with higher model numbers.
* Model 1: Approximately 76%
* Model 2: Approximately 73%
* Model 3: Approximately 85%
* Model 4: Approximately 88%
* Model 5: Approximately 94%
* **SWE-bench Verified (Brown, Square Markers):** The line increases sharply until Model 8, then decreases slightly.
* Model 4: Approximately 41%
* Model 5: Approximately 49%
* Model 6: Approximately 70%
* Model 8: Approximately 80%
* Model 10: Approximately 75%
* **Terminal-bench (Cyan, Triangle Markers):** The line shows a peak at Model 9.
* Model 8: Approximately 41%
* Model 9: Approximately 50%
* Model 10: Approximately 43%
### Key Observations
* HumanEval scores consistently increase as the model number increases.
* SWE-bench Verified scores increase significantly from Model 4 to Model 8, then slightly decrease.
* Terminal-bench scores are significantly lower than the other two benchmarks, peaking at Model 9.
### Interpretation
The chart suggests that models generally improve in performance on the HumanEval benchmark as the model number increases. The SWE-bench Verified benchmark shows a significant improvement up to a certain model number, after which the performance plateaus or slightly decreases. The Terminal-bench benchmark shows a different performance pattern, with a peak at Model 9, and overall lower scores compared to the other benchmarks. This could indicate that different models are better suited for different types of tasks or benchmarks. The models are likely being iterated upon, with each new model number representing an improvement or change in architecture. The data suggests that the models are improving in "human-like" tasks (HumanEval) and software engineering tasks (SWE-bench), but struggle with "terminal" tasks (Terminal-bench).