## Line Chart: Model Performance Comparison
### Overview
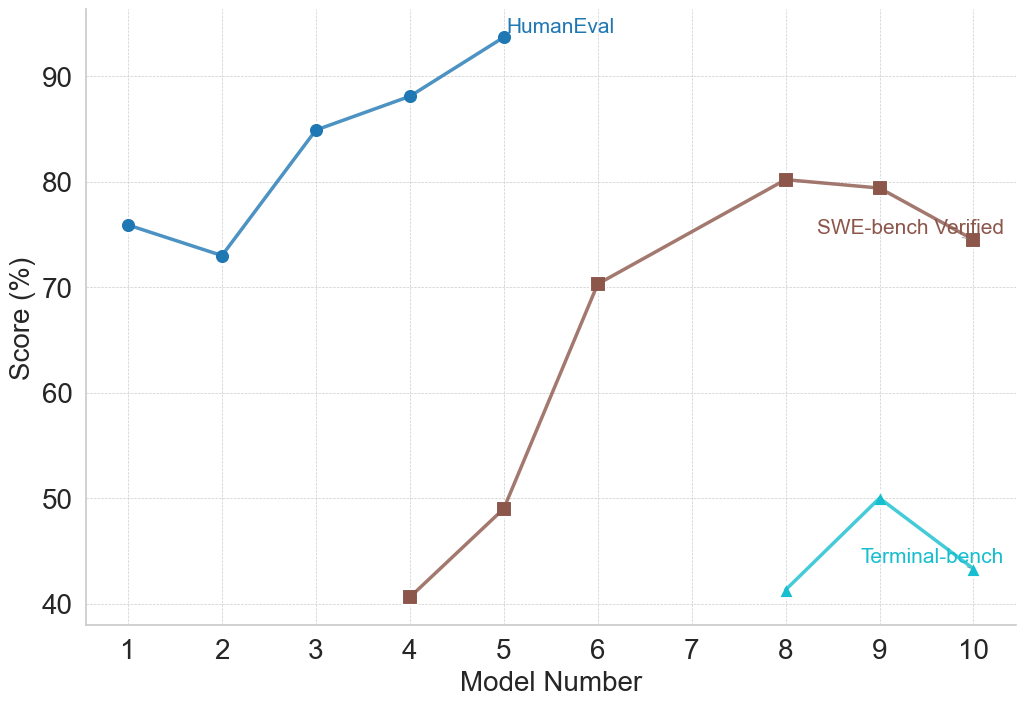
This image presents a line chart comparing the performance of models across three different evaluation benchmarks: HumanEval, SWE-bench Verified, and Terminal-bench. The x-axis represents the Model Number (ranging from 1 to 10), and the y-axis represents the Score in percentage (ranging from 40% to 90%). The chart displays the performance trends of each benchmark as a distinct line.
### Components/Axes
* **X-axis:** Model Number (1 to 10)
* **Y-axis:** Score (%) (40 to 90)
* **Lines/Benchmarks:**
* HumanEval (Blue)
* SWE-bench Verified (Gray)
* Terminal-bench (Teal)
* **Legend:** Located in the top-right corner, labeling each line with its corresponding benchmark name.
### Detailed Analysis
* **HumanEval (Blue Line):** The blue line representing HumanEval shows an upward trend.
* Model 1: Approximately 74%
* Model 2: Approximately 73%
* Model 3: Approximately 84%
* Model 4: Approximately 88%
* Model 5: Approximately 93%
* Model 6: Approximately 92%
* Model 7: Approximately 92%
* Model 8: Approximately 81%
* Model 9: Approximately 76%
* Model 10: Approximately 76%
* **SWE-bench Verified (Gray Line):** The gray line representing SWE-bench Verified shows a significant upward trend, starting from a low score and increasing substantially.
* Model 1: Approximately 70%
* Model 2: Approximately 71%
* Model 3: Approximately 72%
* Model 4: Approximately 40%
* Model 5: Approximately 48%
* Model 6: Approximately 72%
* Model 7: Approximately 78%
* Model 8: Approximately 80%
* Model 9: Approximately 74%
* Model 10: Approximately 75%
* **Terminal-bench (Teal Line):** The teal line representing Terminal-bench shows a relatively flat trend with some fluctuations.
* Model 1: Approximately 42%
* Model 2: Approximately 41%
* Model 3: Approximately 44%
* Model 4: Approximately 40%
* Model 5: Approximately 40%
* Model 6: Approximately 40%
* Model 7: Approximately 40%
* Model 8: Approximately 40%
* Model 9: Approximately 50%
* Model 10: Approximately 48%
### Key Observations
* HumanEval consistently achieves the highest scores across all models, peaking around Model 5.
* SWE-bench Verified shows the most significant improvement in performance as the Model Number increases, starting from a lower baseline.
* Terminal-bench exhibits the lowest scores and the least amount of variation, remaining relatively stable around 40-50%.
* There is a dip in HumanEval performance between Model 8 and Model 10.
* SWE-bench Verified shows a large drop in performance at Model 4.
### Interpretation
The chart demonstrates the performance of different models across three distinct benchmarks designed to evaluate different aspects of code generation or understanding. HumanEval appears to be the easiest benchmark for these models, consistently achieving high scores. SWE-bench Verified shows that model performance can be significantly improved with increased model number, suggesting that more complex models are better suited for this benchmark. Terminal-bench, however, remains a challenge, with scores consistently lower than the other two benchmarks. The dip in HumanEval performance at the higher model numbers could indicate overfitting or a diminishing return on model complexity for that specific benchmark. The large drop in SWE-bench Verified at Model 4 is an anomaly that warrants further investigation. Overall, the chart provides valuable insights into the strengths and weaknesses of these models across different evaluation criteria.