# Technical Document Analysis: Line Chart of Model Performance Scores
## Chart Overview
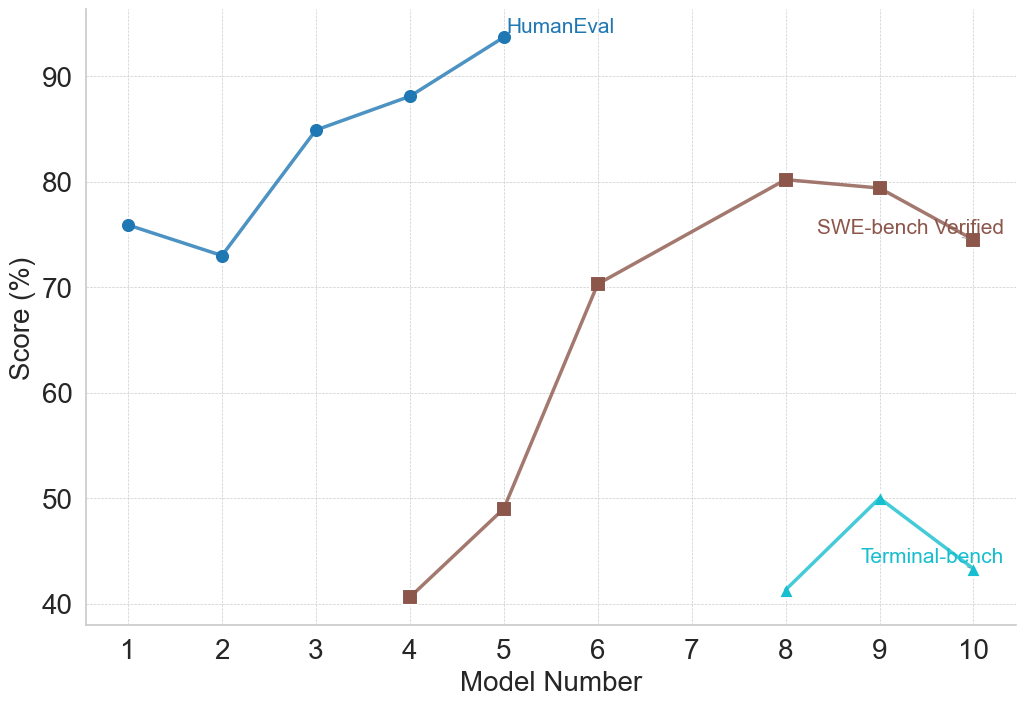
The image depicts a **line chart** comparing performance scores across three evaluation benchmarks (HumanEval, SWE-bench Verified, Terminal-bench) against model numbers 1–10. Scores are represented as percentages on the y-axis.
---
### **Axis Labels**
- **X-axis**: "Model Number" (integer values 1–10)
- **Y-axis**: "Score (%)" (range 40–90)
---
### **Legend**
- **Location**: Top-right corner of the chart
- **Components**:
- **HumanEval**: Blue line with circular markers (○)
- **SWE-bench Verified**: Brown line with square markers (■)
- **Terminal-bench**: Cyan line with triangular markers (▲)
---
### **Data Series Analysis**
#### 1. **HumanEval (Blue Line)**
- **Trend**:
- Initial dip from Model 1 (76%) to Model 2 (73%)
- Steep upward trajectory from Model 3 (85%) to Model 5 (94%)
- Highest score observed at Model 5 (94%)
- **Key Data Points**:
- Model 1: 76%
- Model 2: 73%
- Model 3: 85%
- Model 4: 88%
- Model 5: 94%
#### 2. **SWE-bench Verified (Brown Line)**
- **Trend**:
- Sharp rise from Model 4 (40%) to Model 6 (70%)
- Gradual increase to Model 8 (80%), followed by a decline to Model 10 (75%)
- **Key Data Points**:
- Model 4: 40%
- Model 5: 49%
- Model 6: 70%
- Model 7: 79%
- Model 8: 80%
- Model 9: 79%
- Model 10: 75%
#### 3. **Terminal-bench (Cyan Line)**
- **Trend**:
- Minimal variation between Models 8–9
- Peak at Model 9 (50%), followed by a drop to Model 10 (44%)
- **Key Data Points**:
- Model 8: 41%
- Model 9: 50%
- Model 10: 44%
---
### **Cross-Reference Validation**
- **Legend Colors vs. Line Colors**:
- Blue (○) → HumanEval ✅
- Brown (■) → SWE-bench Verified ✅
- Cyan (▲) → Terminal-bench ✅
- **Marker Consistency**: All markers align with legend specifications.
---
### **Spatial Grounding**
- **Legend Position**: Top-right quadrant (outside the plot area)
- **Data Point Alignment**: All markers correspond to their respective lines and axes.
---
### **Additional Observations**
- No embedded text, data tables, or non-English content detected.
- Chart focuses exclusively on quantitative performance trends across three benchmarks.
---
### **Conclusion**
The chart illustrates divergent performance trends:
1. **HumanEval** shows the highest scores, peaking at Model 5.
2. **SWE-bench Verified** demonstrates significant improvement from Model 4 onward but declines slightly by Model 10.
3. **Terminal-bench** remains relatively stable with a minor peak at Model 9.
This analysis confirms the chart’s utility for comparing model efficacy across evaluation frameworks.