# Chart Analysis: Entity Frequency Distribution
## Chart Type
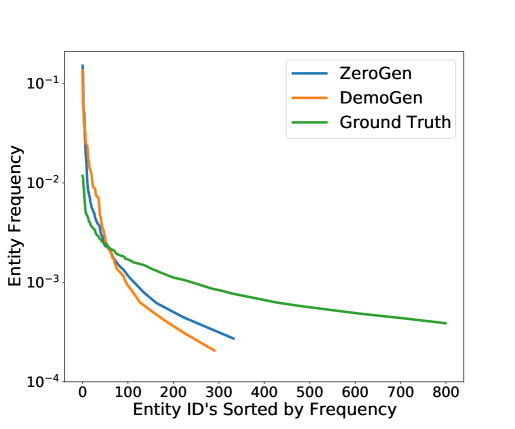
Line chart comparing entity frequency distributions across three datasets.
## Axis Labels
- **X-axis**: "Entity ID's Sorted by Frequency" (logarithmic scale, range: 0–800)
- **Y-axis**: "Entity Frequency" (logarithmic scale, range: 10⁻⁴–10⁻¹)
## Legend
| Color | Label |
|--------|-------------|
| Blue | ZeroGen |
| Orange | DemoGen |
| Green | Ground Truth|
## Key Trends
1. **Initial Sharp Decline**:
- All three lines start at similar high frequencies (~10⁻¹) for low Entity IDs.
- ZeroGen (blue) and DemoGen (orange) drop steeply, crossing below Ground Truth (green) around Entity ID 100.
- Ground Truth maintains higher frequencies than ZeroGen/DemoGen after the crossover.
2. **Flattening Phase**:
- ZeroGen and DemoGen flatten near Entity ID 300, with frequencies approaching 10⁻³–10⁻⁴.
- Ground Truth continues a gradual decline, ending near 10⁻⁴ at Entity ID 800.
3. **Logarithmic Scale Impact**:
- Y-axis compression emphasizes differences in low-frequency entities.
- Ground Truth demonstrates a more uniform distribution across higher Entity IDs compared to the other datasets.
## Data Points
- **ZeroGen**:
- Starts at ~10⁻¹ (Entity ID 0)
- Drops to ~10⁻³ by Entity ID 300
- Flattens near 10⁻⁴ after Entity ID 300
- **DemoGen**:
- Starts at ~10⁻¹ (Entity ID 0)
- Drops to ~10⁻³ by Entity ID 200
- Flattens near 10⁻⁴ after Entity ID 200
- **Ground Truth**:
- Starts at ~10⁻² (Entity ID 0)
- Declines gradually to ~10⁻⁴ by Entity ID 800
- Maintains higher frequencies than ZeroGen/DemoGen after Entity ID 100
## Observations
- ZeroGen and DemoGen exhibit similar initial behavior but diverge after Entity ID 100.
- Ground Truth shows a more stable, long-tail distribution.
- Logarithmic scaling highlights the dominance of high-frequency entities in all datasets.