## Step Histogram: Number of instances resolved (per bin of turns)
### Overview
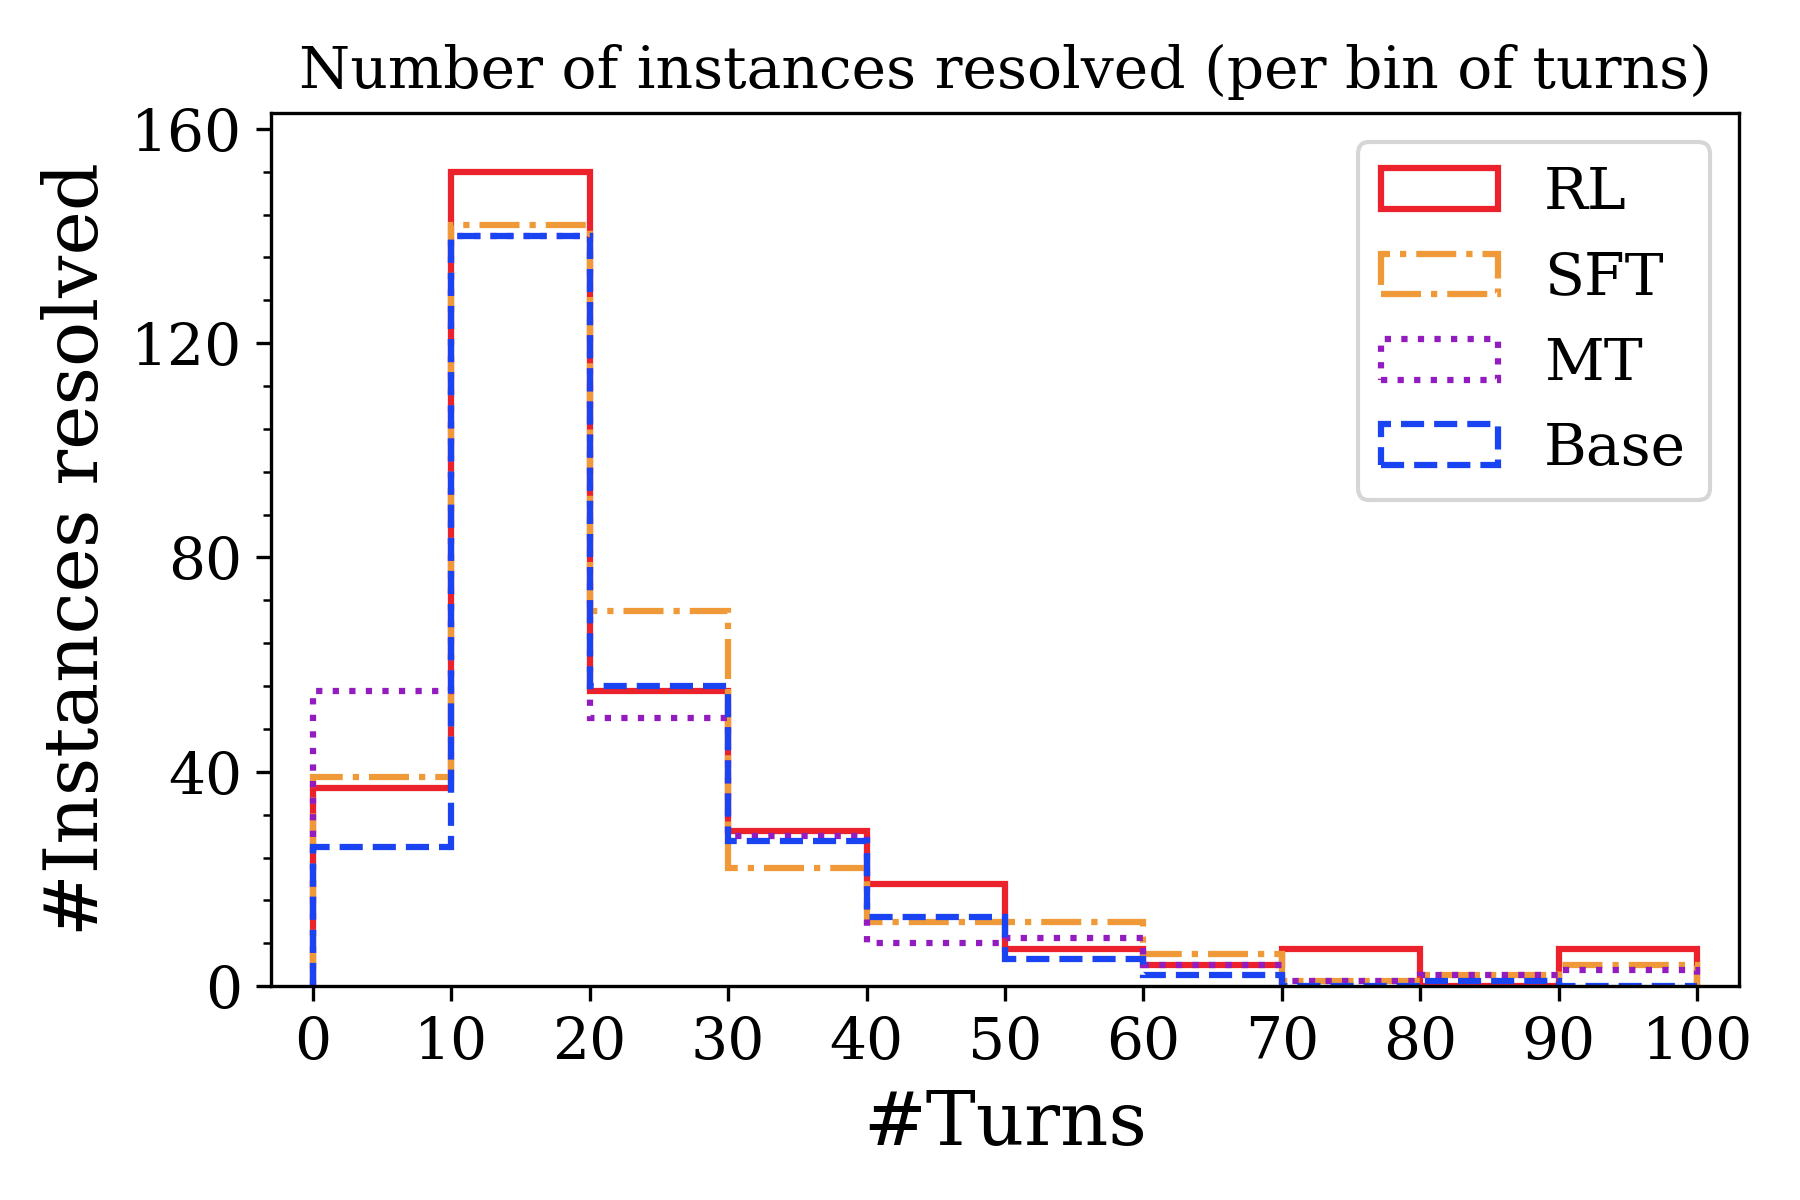
The image is a technical step histogram (or step chart) displaying the distribution of resolved instances across different numbers of turns for four distinct computational models or methodologies. The chart illustrates how many turns it takes for each method to resolve an instance, grouped into bins of 10 turns, ranging from 0 to 100 turns.
### Components/Axes
**Header Region:**
* **Title:** Located at the top center, reading exactly: "Number of instances resolved (per bin of turns)".
**Main Chart Region (Axes & Scale):**
* **Y-axis (Vertical, Left):**
* **Label:** "#Instances resolved" (Rotated 90 degrees counter-clockwise, reading bottom to top).
* **Scale:** Major tick marks are labeled at 0, 40, 80, 120, and 160.
* **Minor Ticks:** There are three minor tick marks between each major interval, indicating increments of 10 units per minor tick.
* **X-axis (Horizontal, Bottom):**
* **Label:** "#Turns" (Centered below the axis numbers).
* **Scale:** Major tick marks are labeled at intervals of 10: 0, 10, 20, 30, 40, 50, 60, 70, 80, 90, 100.
**Legend Region:**
* **Placement:** Located in the top-right quadrant of the chart area, enclosed in a light gray bounding box.
* **Mappings (Cross-referenced with chart lines):**
* **Solid Red Line:** Labeled "RL"
* **Dash-dot Orange Line:** Labeled "SFT"
* **Dotted Purple Line:** Labeled "MT"
* **Dashed Blue Line:** Labeled "Base"
### Detailed Analysis
**Trend Verification:**
Before extracting specific data points, the visual trends for each series are established to ensure logical consistency:
* **General Trend (All Series):** All four models exhibit a right-skewed distribution. They start with a moderate number of resolutions in the 0-10 bin, experience a massive, dominant spike in the 10-20 bin, drop sharply in the 20-30 bin, and then form a long, gradually decaying tail approaching zero as turns reach 100.
* **RL (Solid Red):** Starts moderately low, achieves the absolute highest peak of any model in the 10-20 bin, drops steeply but remains competitive in the mid-ranges, and shows slight, anomalous bumps in the 70-80 and 90-100 bins.
* **SFT (Dash-dot Orange):** Starts moderately low, hits the second-highest peak in the 10-20 bin, and notably sustains the highest resolution rate in the 20-30 bin before decaying.
* **MT (Dotted Purple):** Exhibits the highest initial resolution rate in the 0-10 bin, spikes to tie for third in the 10-20 bin, and generally decays faster than RL and SFT in the mid-to-late turns.
* **Base (Dashed Blue):** Starts with the lowest resolution rate in the 0-10 bin, spikes to tie MT in the 10-20 bin, and generally forms the lowest boundary of the tail from 50 turns onward.
**Data Extraction Table:**
*Note: Values are approximate (denoted by ~) based on visual alignment with the Y-axis major and minor tick marks.*
| Turn Bin (X-axis) | RL (Solid Red) | SFT (Dash-dot Orange) | MT (Dotted Purple) | Base (Dashed Blue) |
| :--- | :--- | :--- | :--- | :--- |
| **0 - 10** | ~38 | ~39 | ~55 | ~26 |
| **10 - 20** | ~152 | ~142 | ~140 | ~140 |
| **20 - 30** | ~55 | ~70 | ~50 | ~56 |
| **30 - 40** | ~29 | ~22 | ~28 | ~27 |
| **40 - 50** | ~19 | ~12 | ~8 | ~13 |
| **50 - 60** | ~7 | ~12 | ~9 | ~5 |
| **60 - 70** | ~4 | ~6 | ~4 | ~2 |
| **70 - 80** | ~7 | ~1 | ~1 | ~1 |
| **80 - 90** | ~2 | ~2 | ~2 | ~1 |
| **90 - 100** | ~7 | ~4 | ~3 | ~1 |
### Key Observations
1. **The "Sweet Spot":** The vast majority of instances across all models are resolved between 10 and 20 turns. The peak for RL (~152) is nearly triple its next highest bin (~55 in the 20-30 bin).
2. **Early Resolution Variance:** In the 0-10 turn bin, the MT model significantly outperforms the others (~55 instances vs. Base's ~26).
3. **Mid-Turn Sustenance:** The SFT model shows a unique resilience in the 20-30 turn bin, resolving ~70 instances, which is noticeably higher than the other three models in that specific range.
4. **Long Tail Anomalies:** The RL model shows slight, unexpected increases in resolutions very late in the process (bins 70-80 and 90-100), whereas the Base model almost entirely flatlines after 60 turns.
### Interpretation
The data demonstrates the efficiency and behavioral characteristics of four different models (likely Large Language Models or conversational agents, given the terminology "turns", "RL" [Reinforcement Learning], "SFT" [Supervised Fine-Tuning], and "Base").
* **Optimal Interaction Length:** The overwhelming concentration of resolved instances in the 10-20 turn bin suggests that the tasks being evaluated have a natural complexity requiring a brief back-and-forth. If an instance is not resolved within 30 turns, the probability of it being resolved at all drops precipitously.
* **Model Characteristics:**
* **MT** is highly effective at solving simple problems quickly (0-10 turns) but loses its comparative advantage as interactions lengthen.
* **RL** is the most capable model when the interaction hits the expected complexity (10-20 turns). It also shows a stubbornness or capability to eventually solve edge-case problems that drag on to 70-100 turns.
* **SFT** is the most robust model for slightly more complex interactions that spill over the average, dominating the 20-30 turn range.
* **Base** is the least capable overall. It struggles to solve things quickly (lowest in 0-10) and gives up or fails almost entirely on long, complex interactions (lowest from 60-100).
* **Peircean Investigative Reading:** The sharp drop-off after 30 turns implies a threshold of diminishing returns. From a system design or UX perspective, this chart suggests that if an agent has not resolved a user's issue by turn 30, it might be more efficient to escalate to a human or reset the prompt, as the models are highly unlikely to find a resolution in the subsequent 70 turns.