## Chart: Number of Instances Resolved per Bin of Turns
### Overview
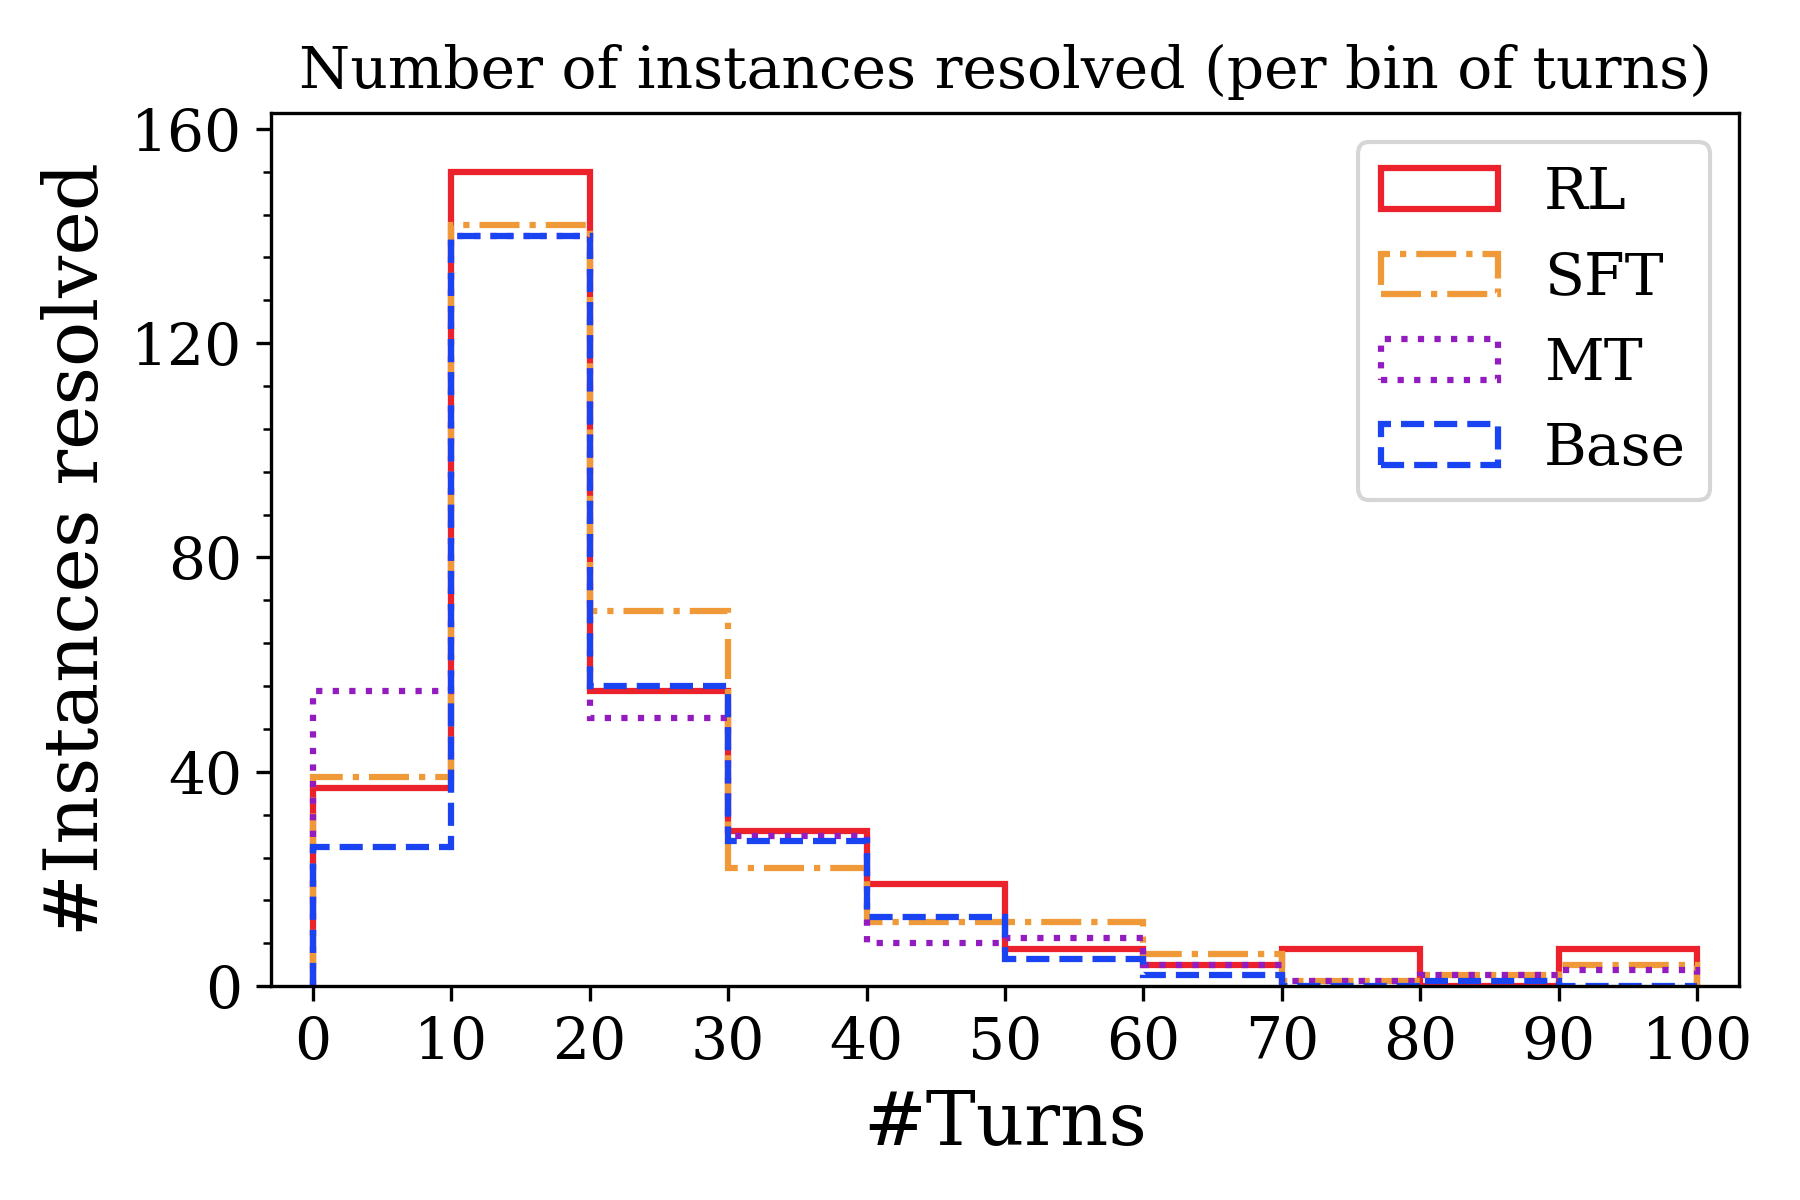
The image is a step chart comparing the number of instances resolved across different numbers of turns for four different methods: RL (Reinforcement Learning), SFT (Supervised Fine-Tuning), MT (Machine Translation), and a Base method. The x-axis represents the number of turns, grouped into bins of 10, and the y-axis represents the number of instances resolved.
### Components/Axes
* **Title:** "Number of instances resolved (per bin of turns)"
* **X-axis:**
* Label: "#Turns"
* Scale: 0 to 100, with markers at 0, 10, 20, 30, 40, 50, 60, 70, 80, 90, and 100. Each bin represents a range of 10 turns (e.g., 0-10, 10-20, etc.).
* **Y-axis:**
* Label: "#Instances resolved"
* Scale: 0 to 160, with markers at 0, 40, 80, 120, and 160.
* **Legend:** Located in the top-right corner of the chart.
* RL: Solid red line
* SFT: Dash-dot orange line
* MT: Dotted purple line
* Base: Dashed blue line
### Detailed Analysis
**RL (Solid Red Line):**
* Trend: Starts at approximately 40 instances resolved for 0-10 turns, jumps to approximately 155 instances resolved for 10-20 turns, and then decreases gradually to approximately 5 instances resolved for 90-100 turns.
* Data Points:
* 0-10 turns: ~40
* 10-20 turns: ~155
* 20-30 turns: ~70
* 30-40 turns: ~30
* 40-50 turns: ~20
* 50-60 turns: ~10
* 60-70 turns: ~10
* 70-80 turns: ~5
* 80-90 turns: ~5
* 90-100 turns: ~5
**SFT (Dash-Dot Orange Line):**
* Trend: Starts at approximately 40 instances resolved for 0-10 turns, jumps to approximately 140 instances resolved for 10-20 turns, and then decreases gradually to approximately 5 instances resolved for 90-100 turns.
* Data Points:
* 0-10 turns: ~40
* 10-20 turns: ~140
* 20-30 turns: ~70
* 30-40 turns: ~30
* 40-50 turns: ~15
* 50-60 turns: ~10
* 60-70 turns: ~5
* 70-80 turns: ~5
* 80-90 turns: ~5
* 90-100 turns: ~5
**MT (Dotted Purple Line):**
* Trend: Starts at approximately 60 instances resolved for 0-10 turns, jumps to approximately 140 instances resolved for 10-20 turns, and then decreases gradually to approximately 5 instances resolved for 90-100 turns.
* Data Points:
* 0-10 turns: ~60
* 10-20 turns: ~140
* 20-30 turns: ~55
* 30-40 turns: ~20
* 40-50 turns: ~15
* 50-60 turns: ~10
* 60-70 turns: ~5
* 70-80 turns: ~5
* 80-90 turns: ~5
* 90-100 turns: ~5
**Base (Dashed Blue Line):**
* Trend: Starts at approximately 30 instances resolved for 0-10 turns, jumps to approximately 140 instances resolved for 10-20 turns, and then decreases gradually to approximately 5 instances resolved for 90-100 turns.
* Data Points:
* 0-10 turns: ~30
* 10-20 turns: ~140
* 20-30 turns: ~60
* 30-40 turns: ~15
* 40-50 turns: ~10
* 50-60 turns: ~5
* 60-70 turns: ~5
* 70-80 turns: ~5
* 80-90 turns: ~5
* 90-100 turns: ~5
### Key Observations
* All four methods show a similar trend: a high number of instances resolved within the first 20 turns, followed by a gradual decrease as the number of turns increases.
* RL resolves the most instances in the 10-20 turn bin.
* MT resolves the most instances in the 0-10 turn bin.
* The number of instances resolved is very low for all methods after 60 turns.
### Interpretation
The chart suggests that all four methods are most effective at resolving instances within a relatively small number of turns (0-20). As the number of turns increases, the effectiveness of all methods decreases significantly. The RL method appears to be slightly more effective than the other methods in the 10-20 turn range, while MT is more effective in the 0-10 turn range. The similarity in the trends suggests that the underlying problem being addressed may have inherent limitations that make it difficult to resolve instances with a large number of turns.