\n
## Line Chart: Number of Instances Resolved (per bin of turns)
### Overview
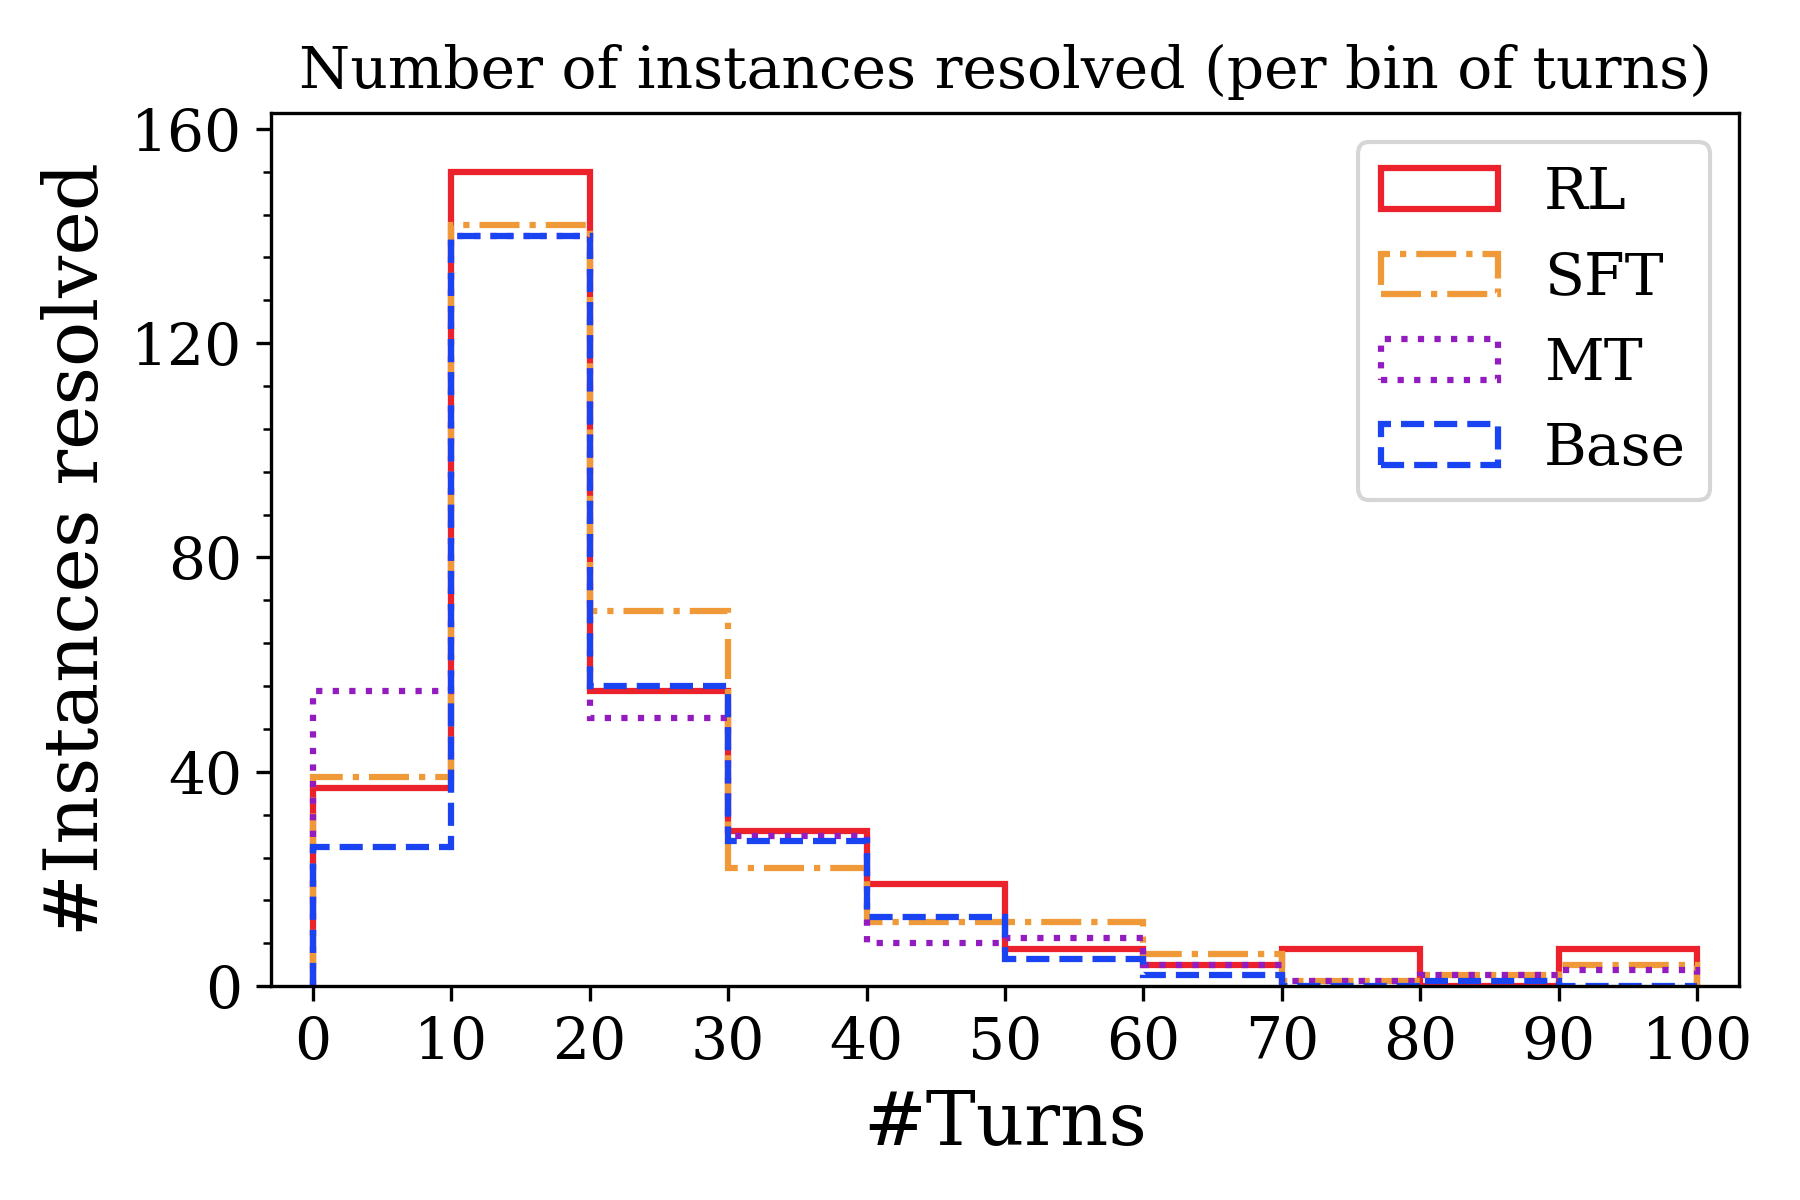
This line chart depicts the number of instances resolved as a function of the number of turns, comparing four different models: RL, SFT, MT, and Base. The y-axis represents the number of instances resolved, while the x-axis represents the number of turns, binned from 0 to 100.
### Components/Axes
* **Title:** Number of instances resolved (per bin of turns)
* **X-axis Label:** #Turns (ranging from 0 to 100, in increments of 10)
* **Y-axis Label:** #Instances resolved (ranging from 0 to 160, in increments of 20)
* **Legend:** Located in the top-right corner, containing the following labels and corresponding colors:
* RL (Red) - Solid line
* SFT (Orange) - Dashed line
* MT (Purple) - Dotted line
* Base (Blue) - Dash-dot line
### Detailed Analysis
* **RL (Red):** The RL line starts at approximately 150 instances resolved at 0 turns, rapidly drops to around 70 instances at 20 turns, and then plateaus around 10-20 instances resolved for turns greater than 30.
* **SFT (Orange):** The SFT line begins at approximately 35 instances resolved at 0 turns, increases slightly to around 50 instances at 10 turns, then decreases to around 20-30 instances resolved between 20 and 100 turns.
* **MT (Purple):** The MT line starts at approximately 50 instances resolved at 0 turns, drops sharply to around 10 instances at 20 turns, and remains relatively stable at around 5-15 instances resolved for turns greater than 20.
* **Base (Blue):** The Base line begins at approximately 30 instances resolved at 0 turns, drops to around 20 instances at 20 turns, and then remains relatively stable at around 10-20 instances resolved for turns greater than 20.
### Key Observations
* The RL model resolves a significantly higher number of instances at lower turn counts (0-20) compared to the other models.
* All models exhibit a decreasing trend in the number of instances resolved as the number of turns increases.
* The MT and Base models show similar behavior, with a sharp initial drop followed by a relatively stable plateau.
* The SFT model shows a more gradual decrease in instances resolved.
### Interpretation
The chart suggests that the RL model is most effective at resolving instances quickly, requiring fewer turns. However, its effectiveness diminishes rapidly after approximately 20 turns. The other models (SFT, MT, and Base) are less effective initially but maintain a more consistent level of resolution over a larger number of turns. This could indicate that the RL model excels at simple cases that can be resolved quickly, while the other models are better suited for more complex instances that require more interaction. The rapid decline in resolution for all models as the number of turns increases suggests a point of diminishing returns, where further interaction does not significantly improve the resolution rate. The differences in the curves could be due to the underlying algorithms and training data used for each model. The chart highlights a trade-off between initial resolution speed (RL) and sustained resolution capability (SFT, MT, Base).