## Step Histogram: Number of Instances Resolved (Per Bin of Turns)
### Overview
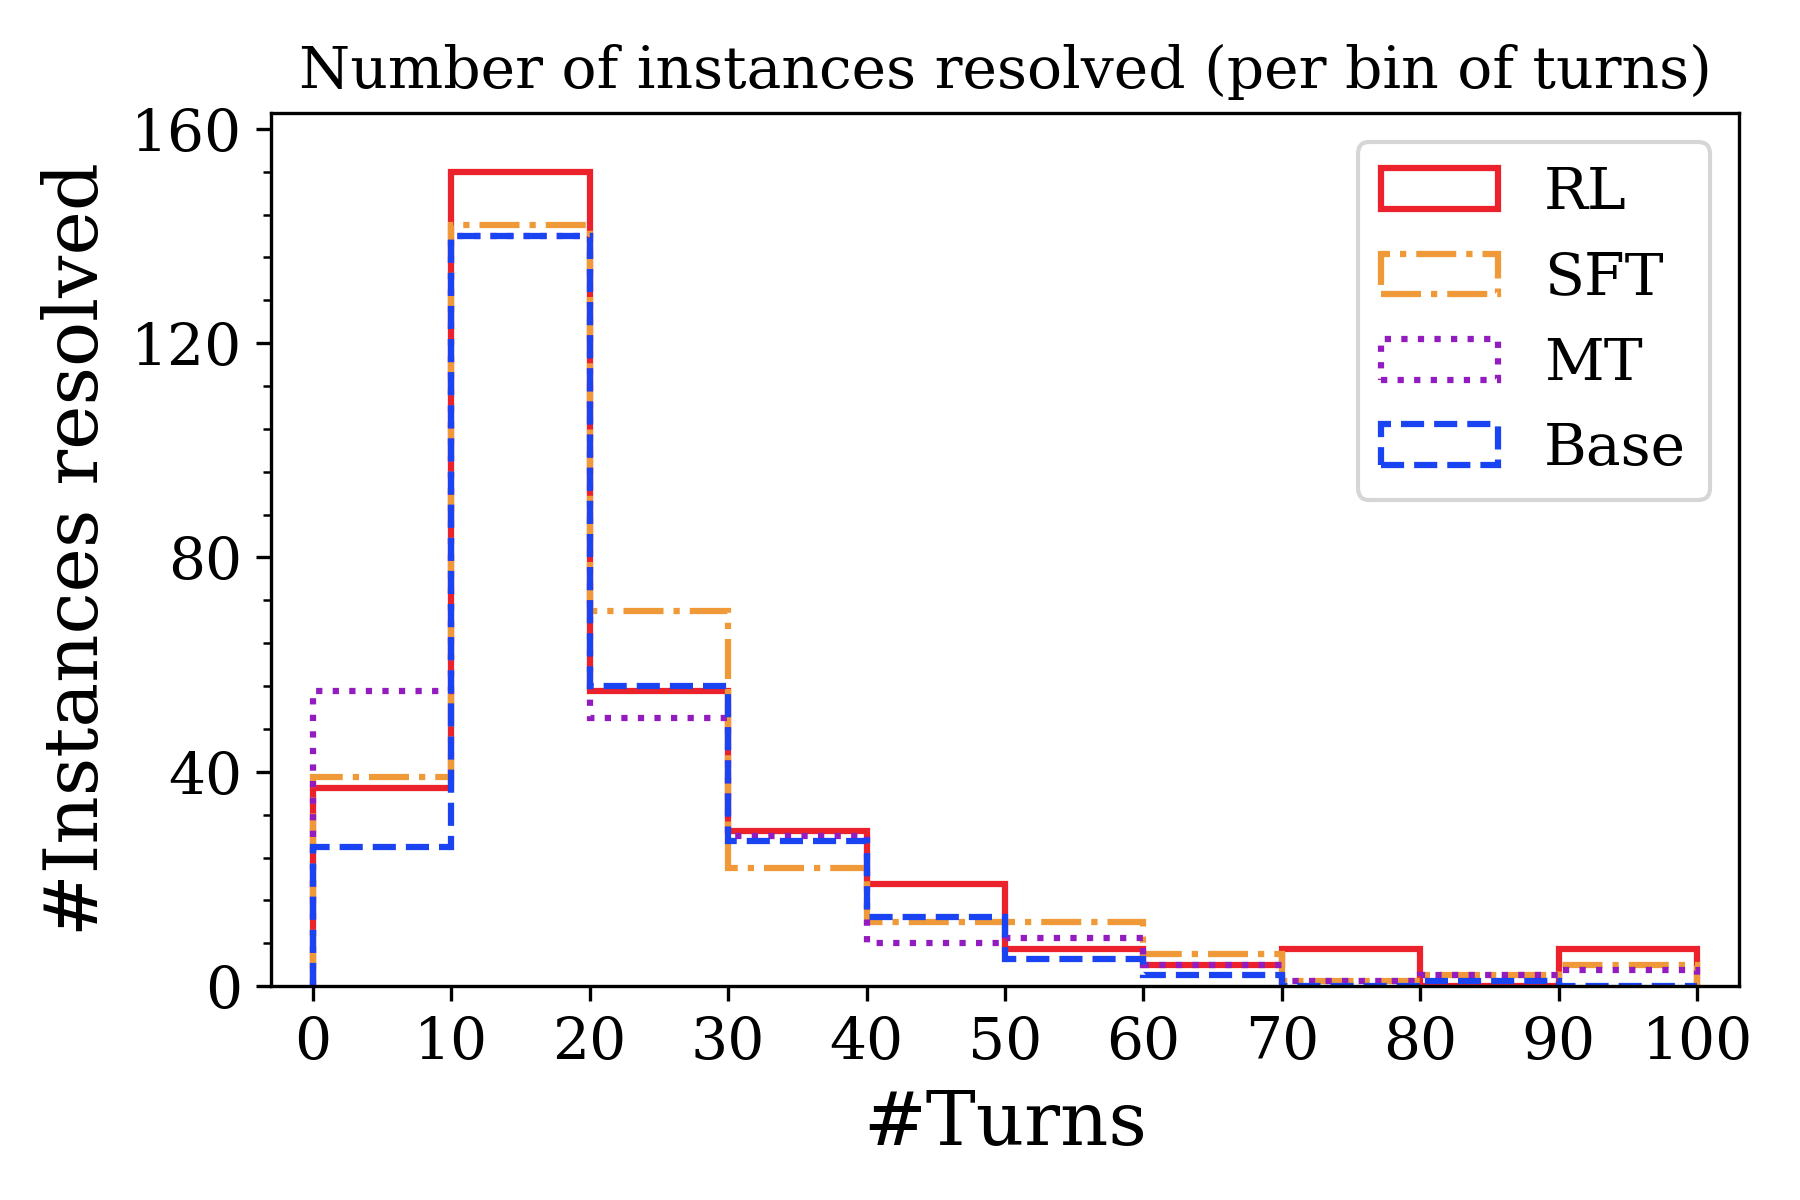
This image is a step histogram (or step plot) comparing the performance of four different models or methods—RL, SFT, MT, and Base—on a task. The chart displays how many problem instances were successfully resolved, grouped by the number of conversational turns required for resolution. The data suggests a performance comparison across different interaction lengths.
### Components/Axes
* **Chart Title:** "Number of instances resolved (per bin of turns)"
* **Y-Axis:**
* **Label:** "#Instances resolved"
* **Scale:** Linear, from 0 to 160.
* **Major Tick Marks:** 0, 40, 80, 120, 160.
* **X-Axis:**
* **Label:** "#Turns"
* **Scale:** Linear, binned in increments of 10.
* **Bins (Tick Marks):** 0, 10, 20, 30, 40, 50, 60, 70, 80, 90, 100.
* **Legend:** Located in the top-right corner of the plot area.
* **RL:** Solid red line.
* **SFT:** Dash-dot orange line.
* **MT:** Dotted purple line.
* **Base:** Dashed blue line.
### Detailed Analysis
The chart shows the count of resolved instances for each model within specific turn-count bins (e.g., 0-10 turns, 10-20 turns). Values are approximate based on visual inspection of the step heights.
**Trend Verification:** All four data series follow a similar visual trend: a sharp peak in the 10-20 turn bin, followed by a general decline as the number of turns increases. The RL series consistently shows the highest or near-highest resolved count in most bins.
**Data Points by Bin (Approximate Values):**
* **Bin 0-10 Turns:**
* MT: ~55 instances (highest)
* SFT: ~38
* RL: ~38
* Base: ~25 (lowest)
* **Bin 10-20 Turns (Peak for all models):**
* RL: ~155 instances (highest peak)
* SFT: ~145
* Base: ~140
* MT: ~140
* **Bin 20-30 Turns:**
* SFT: ~70 instances (highest)
* RL: ~55
* Base: ~55
* MT: ~50
* **Bin 30-40 Turns:**
* RL: ~30 instances
* Base: ~28
* MT: ~25
* SFT: ~22
* **Bin 40-50 Turns:**
* RL: ~20 instances
* SFT: ~15
* Base: ~12
* MT: ~8
* **Bin 50-60 Turns:**
* SFT: ~12 instances
* RL: ~8
* Base: ~5
* MT: ~5
* **Bin 60-70 Turns:**
* SFT: ~8 instances
* RL: ~5
* Base: ~2
* MT: ~2
* **Bin 70-80 Turns:**
* RL: ~8 instances (notable small rise)
* SFT: ~5
* Base: ~2
* MT: ~2
* **Bin 80-90 Turns:**
* SFT: ~5 instances
* RL: ~2
* Base: ~2
* MT: ~2
* **Bin 90-100 Turns:**
* RL: ~8 instances (another small rise)
* SFT: ~5
* Base: ~2
* MT: ~2
### Key Observations
1. **Universal Peak:** All models achieve their highest number of resolved instances in the 10-20 turn bin, indicating this is the most common length for successful resolution.
2. **RL Dominance at Peak:** The RL model has the highest peak performance (~155 instances) in the 10-20 turn range.
3. **Performance Decline:** For all models, the number of resolved instances drops significantly as the required number of turns increases beyond 20.
4. **MT's Early Strength:** The MT model performs best relative to others in the shortest bin (0-10 turns).
5. **SFT's Mid-Range Strength:** The SFT model shows the highest resolved count in the 20-30 turn bin.
6. **Long-Tail Performance:** In the higher turn bins (70+), the resolved counts are very low for all models, though RL shows minor, isolated increases in the 70-80 and 90-100 bins.
### Interpretation
This chart likely evaluates AI models on a conversational or multi-step task (e.g., dialogue systems, problem-solving agents). The "turns" represent interaction steps, and "instances resolved" are successful task completions.
* **What the data suggests:** The task is most frequently solvable within 10-20 interactions. Solving it requires more than 30 turns is progressively rarer, suggesting either increased difficulty or a dataset skewed towards shorter solutions.
* **Model Comparison:** RL appears most effective for the most common case (10-20 turns). MT may be better for very quick resolutions, while SFT holds an edge for slightly longer interactions (20-30 turns). The "Base" model generally underperforms the specialized methods (RL, SFT, MT).
* **Anomalies:** The small bumps for RL in the 70-80 and 90-100 turn bins are interesting. They could indicate a subset of very difficult problems that the RL model is uniquely capable of solving, or they could be statistical noise given the low counts.
* **Underlying Message:** The visualization argues for the effectiveness of trained models (RL, SFT, MT) over a base model, with RL showing particular strength for the most common resolution path. It also highlights the inherent challenge of the task as interaction length grows.