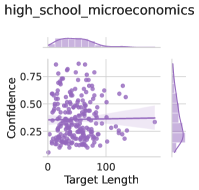
## Scatter Plot: Confidence vs. Target Length
### Overview
The image is a scatter plot showing the relationship between "Confidence" and "Target Length". The plot includes marginal distributions for each variable along the top and right sides. The scatter plot itself displays individual data points, and a regression line with a confidence interval is overlaid.
### Components/Axes
* **Title:** high\_school\_microeconomics
* **X-axis:** Target Length
* Scale: 0 to 100
* **Y-axis:** Confidence
* Scale: 0 to 0.75
* **Data Points:** Purple dots representing individual data points.
* **Regression Line:** A light purple line with a shaded confidence interval.
* **Marginal Distributions:** Histograms along the top and right edges showing the distribution of Target Length and Confidence, respectively.
### Detailed Analysis
* **Target Length:**
* Range: Approximately from 0 to 100.
* Distribution: The marginal distribution along the top suggests a concentration of data points between 0 and 50, with a long tail extending to 100.
* **Confidence:**
* Range: Approximately from 0 to 0.75.
* Distribution: The marginal distribution on the right shows a concentration of data points between 0.25 and 0.5, with fewer points above 0.5.
* **Scatter Plot:**
* The data points are scattered across the plot, with a higher density in the lower-left quadrant (low Target Length, low Confidence).
* The regression line appears to have a slightly positive slope, suggesting a weak positive correlation between Target Length and Confidence.
* The confidence interval around the regression line is relatively wide, indicating a high degree of uncertainty in the relationship.
### Key Observations
* There is a weak positive correlation between Target Length and Confidence.
* The majority of data points have low Target Length and low Confidence.
* The wide confidence interval suggests that the relationship between Target Length and Confidence is not strong.
### Interpretation
The scatter plot suggests that there is a slight tendency for Confidence to increase as Target Length increases, but the relationship is weak and uncertain. The concentration of data points in the lower-left quadrant indicates that most observations have low Target Length and low Confidence. The wide confidence interval around the regression line suggests that other factors may be influencing Confidence besides Target Length.