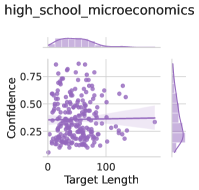
## Scatter Plot: Confidence vs. Target Length in High School Microeconomics
### Overview
The image displays a scatter plot analyzing the relationship between "Target Length" (x-axis) and "Confidence" (y-axis) in a high school microeconomics context. A horizontal dashed line labeled "Confidence Threshold" at 0.50 divides the plot. Two histograms (top and right) show distributions of target lengths and confidence values. Data points are purple, with a shaded region indicating variability around the threshold line.
### Components/Axes
- **X-axis (Target Length)**: Ranges from 0 to 100, labeled "Target Length."
- **Y-axis (Confidence)**: Ranges from 0.25 to 0.75, labeled "Confidence."
- **Legend**: Located in the top-right corner, labeled "Confidence Threshold" with a dashed line at 0.50.
- **Histograms**:
- **Top Histogram**: Distributes target lengths, peaking near 50.
- **Right Histogram**: Distributes confidence values, peaking near 0.4.
### Detailed Analysis
- **Scatter Plot**:
- **Data Points**: ~50 purple dots scattered across the plot. Most points cluster below the 0.50 threshold line.
- **Trend**: A negative correlation is observed: as target length increases, confidence decreases. The shaded region (likely representing a confidence interval) widens slightly at higher target lengths.
- **Key Data Points**:
- Low target length (0–20): Confidence ranges from ~0.3 to 0.6.
- Mid target length (50): Confidence clusters around 0.4–0.5.
- High target length (80–100): Confidence drops to ~0.25–0.4.
- **Histograms**:
- **Target Length Distribution**: Bimodal with peaks near 50 and 80. Most data points fall between 30 and 70.
- **Confidence Distribution**: Unimodal, peaking at ~0.4. Most values range between 0.3 and 0.5.
### Key Observations
1. **Negative Correlation**: Longer target lengths are associated with lower confidence, suggesting complexity or difficulty in achieving higher confidence with increased scope.
2. **Confidence Threshold**: The 0.50 line acts as a benchmark; ~60% of data points fall below this threshold.
3. **Distribution Peaks**: Target lengths cluster around 50, while confidence values center near 0.4, indicating commonality in mid-range performance.
4. **Outliers**: A few points above 0.50 at high target lengths (e.g., 90–100) suggest rare cases of high confidence despite complexity.
### Interpretation
The data implies that in high school microeconomics, students or models exhibit reduced confidence as target lengths increase, possibly due to cognitive load or resource constraints. The 0.50 threshold may represent a practical limit for acceptable confidence in real-world applications. The bimodal target length distribution hints at two common problem sizes (50 and 80 units), while the confidence peak at 0.4 suggests a typical performance baseline. Outliers above the threshold at high target lengths warrant further investigation—could they reflect exceptional cases, simplified models, or data anomalies? This analysis underscores the trade-off between scope and confidence in educational or analytical contexts.