## Chart/Diagram Type: Multimodal Reasoning Guide and Function Plot
### Overview
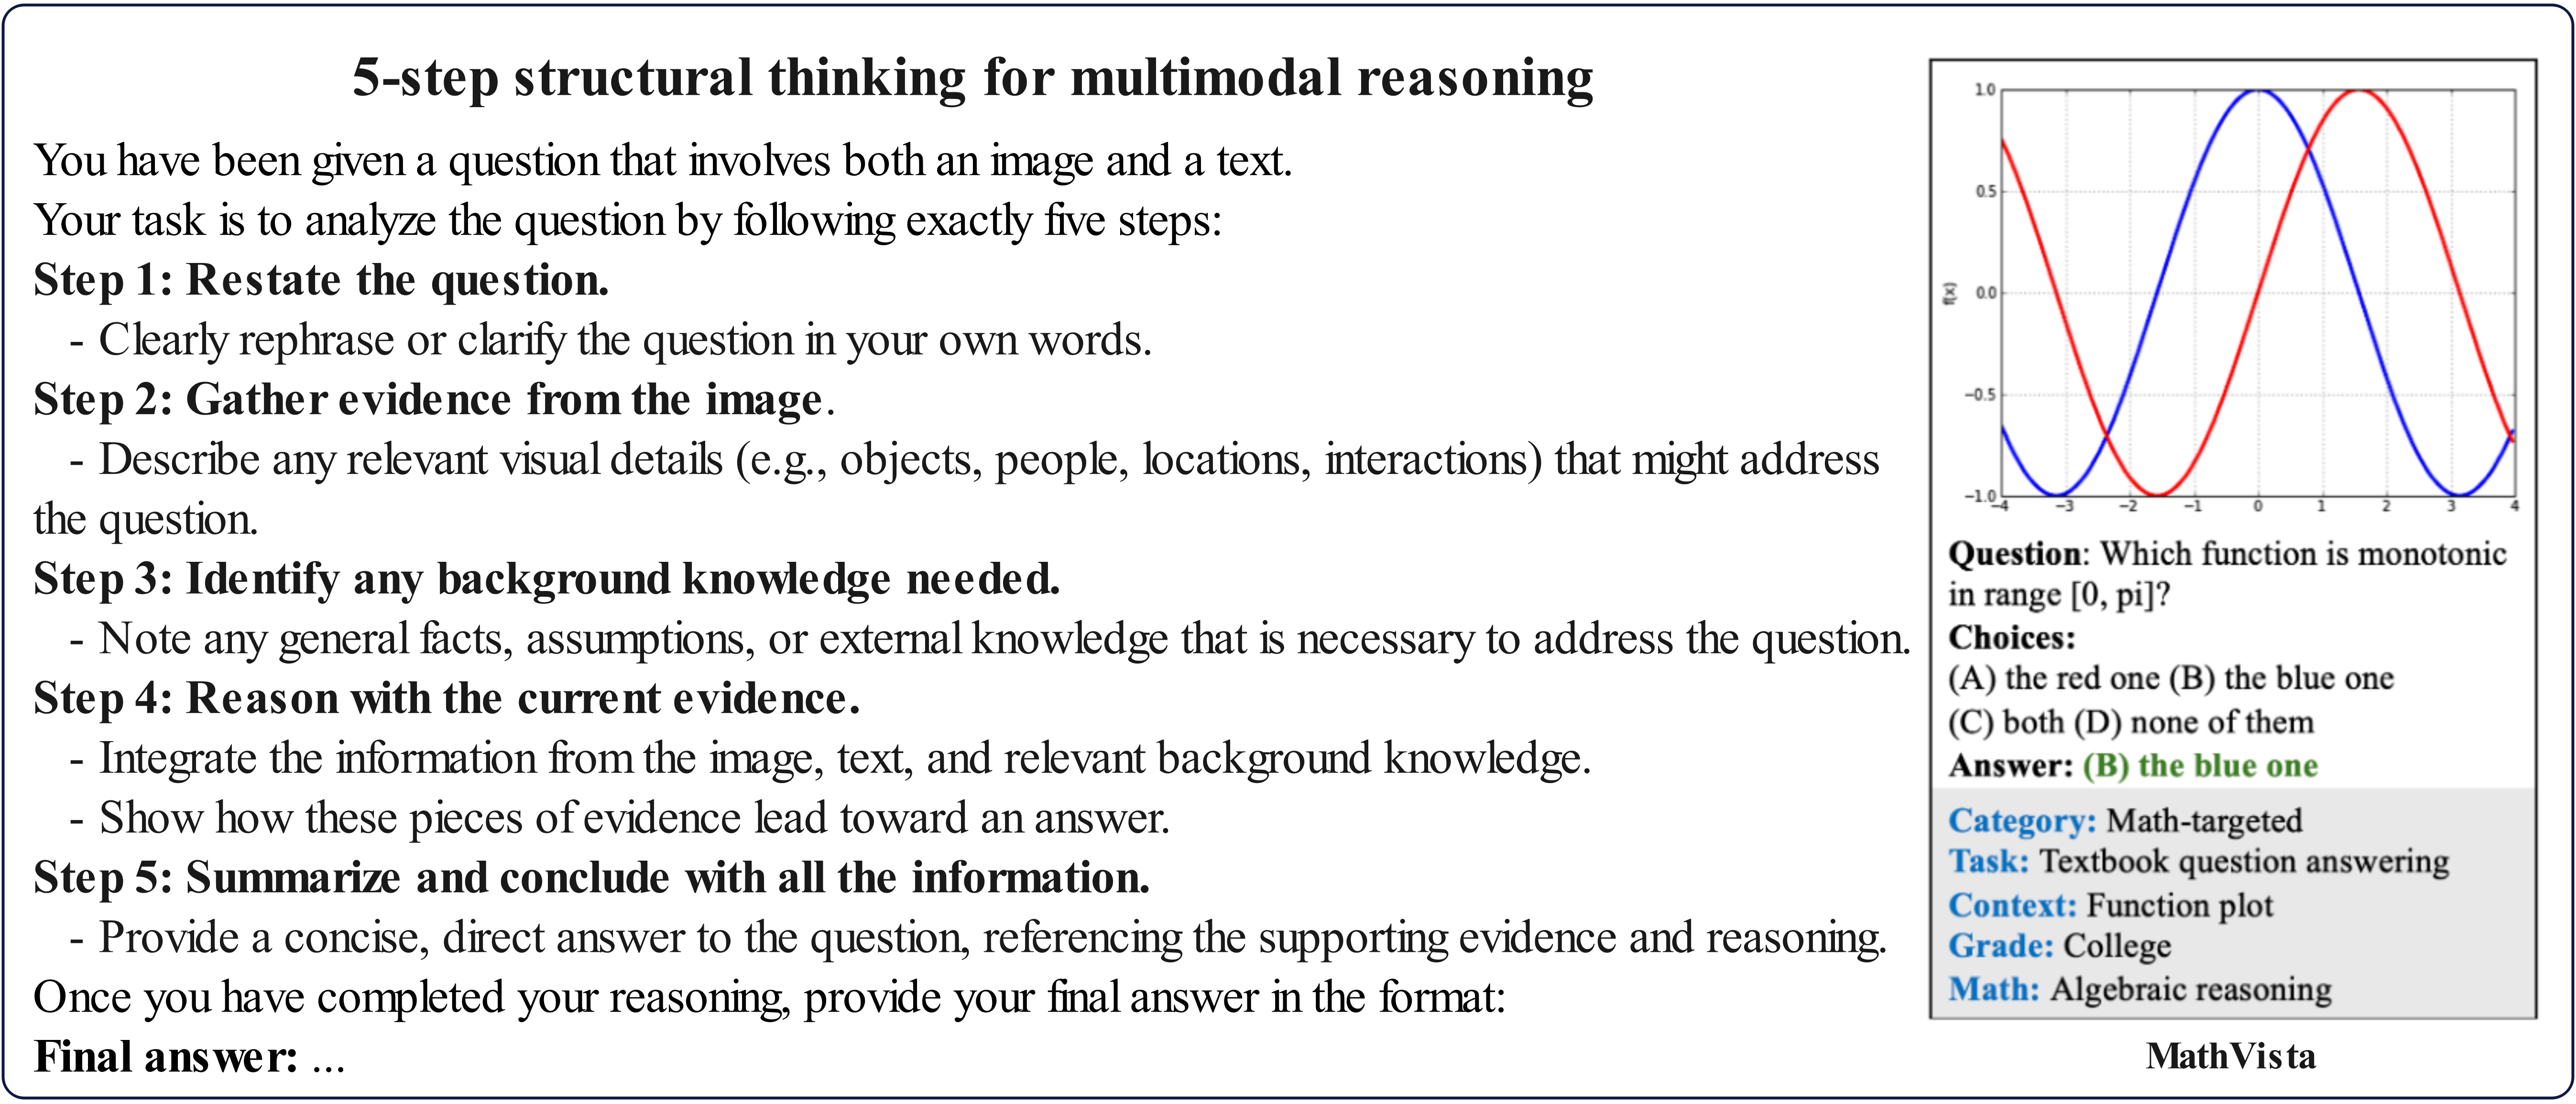
The image presents a 5-step guide for structural thinking in multimodal reasoning, accompanied by a function plot and a multiple-choice question related to the plot. The guide outlines a process for analyzing questions involving both images and text. The function plot displays two trigonometric functions, one red and one blue, over the range of approximately -4 to 4 on the x-axis. The question asks which function is monotonic in the range [0, pi].
### Components/Axes
* **Title:** 5-step structural thinking for multimodal reasoning
* **Steps:**
* Step 1: Restate the question.
* Step 2: Gather evidence from the image.
* Step 3: Identify any background knowledge needed.
* Step 4: Reason with the current evidence.
* Step 5: Summarize and conclude with all the information.
* **Function Plot:**
* X-axis: Ranges from approximately -4 to 4, with tick marks at each integer.
* Y-axis: Labeled "f(x)", ranges from -1.0 to 1.0, with tick marks at -0.5, 0.0, 0.5.
* Red Line: A cosine-like function, peaking at approximately x=2 and x=-2.
* Blue Line: A sine-like function, peaking at approximately x=0.
* **Question:** Which function is monotonic in range [0, pi]?
* **Choices:**
* (A) the red one
* (B) the blue one
* (C) both
* (D) none of them
* **Answer:** (B) the blue one
* **Metadata:**
* Category: Math-targeted
* Task: Textbook question answering
* Context: Function plot
* Grade: College
* Math: Algebraic reasoning
### Detailed Analysis or ### Content Details
* **5-Step Guide:** The guide provides a structured approach to answering questions that involve both images and text. Each step is clearly defined, encouraging a systematic analysis of the problem.
* **Function Plot:**
* The red line starts at approximately 0.8 at x=-4, decreases to -1.0 at x=-1, increases to 1.0 at x=2, and decreases again to approximately -0.8 at x=4.
* The blue line starts at approximately -0.8 at x=-4, increases to 1.0 at x=0, decreases to -1.0 at x=3, and increases again to approximately 0.8 at x=4.
* **Question and Answer:** The question tests the understanding of monotonic functions within a specific range. The correct answer is (B), the blue one, indicating that the blue function is monotonically decreasing in the range [0, pi].
* **Metadata:** The metadata provides context for the question, categorizing it as math-targeted, a textbook question, and suitable for college-level algebraic reasoning.
### Key Observations
* The 5-step guide is designed to promote structured thinking and problem-solving skills.
* The function plot visually represents two trigonometric functions, allowing for a graphical analysis of their behavior.
* The question assesses the ability to identify monotonic functions within a given range.
* The metadata provides valuable context for understanding the purpose and target audience of the question.
### Interpretation
The image combines a methodological guide with a practical example in the form of a mathematical problem. The 5-step guide offers a general framework for approaching multimodal reasoning tasks, while the function plot and question provide a specific instance of such a task. The combination highlights the importance of both structured thinking and domain-specific knowledge in problem-solving. The metadata further contextualizes the problem, indicating its relevance to math education and algebraic reasoning at the college level. The correct answer to the question suggests that the user should be able to visually analyze the graph and understand the concept of monotonicity.