\n
## Chart: Function Plots & Monotonicity Question
### Overview
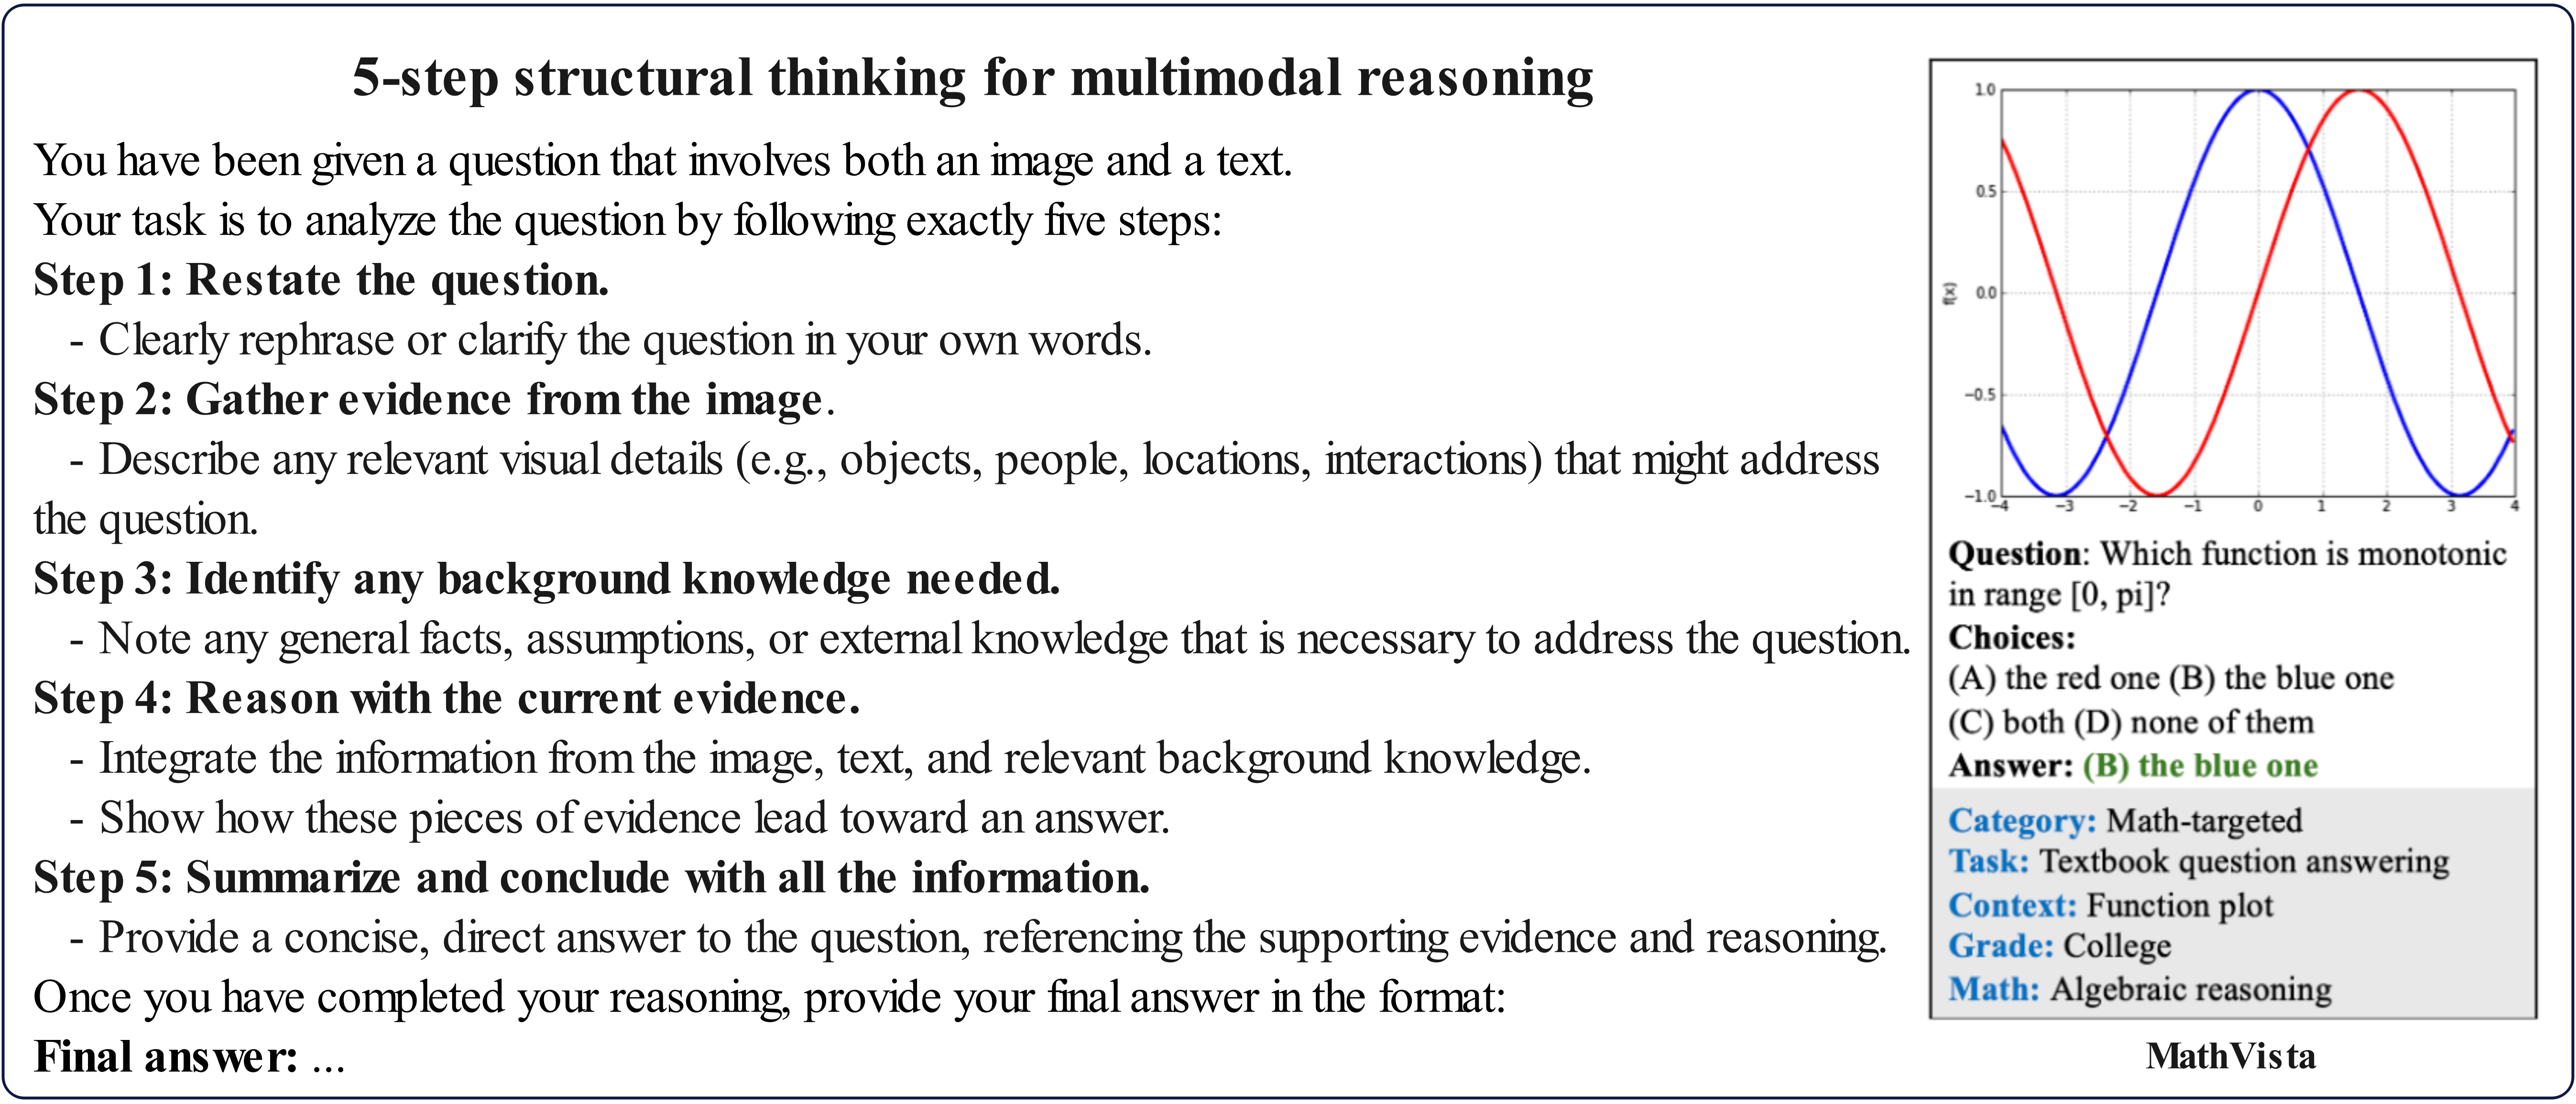
The image presents a chart displaying three function plots alongside a text block outlining a 5-step structural thinking process for multimodal reasoning, and a question regarding monotonicity. The chart is positioned on the right side of the image, while the text is on the left. The question asks which function is monotonic in the range [0, pi].
### Components/Axes
* **Chart Title:** None explicitly stated, but the chart depicts function plots.
* **X-axis Label:** "x"
* **Y-axis Label:** "y"
* **X-axis Scale:** Ranges from approximately -3.5 to 4.5.
* **Y-axis Scale:** Ranges from approximately -1.0 to 0.8.
* **Legend:** Located in the top-right corner of the chart.
* Red Line: Labeled as "red"
* Blue Line: Labeled as "blue"
* Green Line: Labeled as "green"
* **Question:** "Which function is monotonic in range [0, pi]?"
* **Choices:**
* (A) the red one
* (B) the blue one
* (C) both (A) and (B)
* (D) none of them
* **Answer:** (B) the blue one
* **Metadata:**
* Category: Math-targeted
* Task: Textbook question answering
* Context: Function plot
* Grade: College
* Math: Algebraic reasoning
### Detailed Analysis or Content Details
The chart displays three curves:
* **Red Line:** This line exhibits a sinusoidal pattern. It starts at approximately y=0 at x=-3.5, reaches a maximum of approximately y=0.7 at x=-1.5, crosses the x-axis at x=-0.5, reaches a minimum of approximately y=-0.7 at x=1.5, and returns to approximately y=0 at x=3.5. It is *not* monotonic.
* **Blue Line:** This line is a cubic function. It starts at approximately y=-1 at x=-3.5, increases monotonically to approximately y=0.8 at x=4.5. It is monotonic.
* **Green Line:** This line also exhibits a sinusoidal pattern, but is phase-shifted compared to the red line. It starts at approximately y=0.7 at x=-2.5, crosses the x-axis at x=-0.5, reaches a minimum of approximately y=-0.7 at x=1.5, and returns to approximately y=0.7 at x=3.5. It is *not* monotonic.
### Key Observations
* The blue line is the only function that consistently increases within the visible range, indicating monotonicity.
* The red and green lines oscillate, demonstrating non-monotonic behavior.
* The question specifically asks about monotonicity in the range [0, pi]. Since pi is approximately 3.14, the relevant portion of the x-axis is from 0 to 3.14. Within this range, the blue line continues to increase monotonically.
### Interpretation
The data demonstrates the concept of monotonicity in functions. A monotonic function either consistently increases or consistently decreases over a given interval. The blue line fulfills this condition within the specified range [0, pi], while the red and green lines do not due to their oscillatory nature. The question is designed to test understanding of this mathematical concept, and the chart provides the visual evidence to support the correct answer. The 5-step structural thinking process outlined in the text block is a method for approaching multimodal reasoning problems, such as this one, by breaking down the task into smaller, manageable steps. The metadata indicates this is a college-level algebraic reasoning problem.