TECHNICAL ASSET FINGERPRINT
df4ca519b0cb49ccc93ac829
Click to view fullscreen
Press ESC or click to close
FOUND IN PAPERS
EXPERT: healer-alpha-free VERSION 1
RUNTIME: free/openrouter/healer-alpha
INTEL_VERIFIED
## [Diagram/Text Composite]: 5-Step Structural Thinking for Multimodal Reasoning with Math Example
### Overview
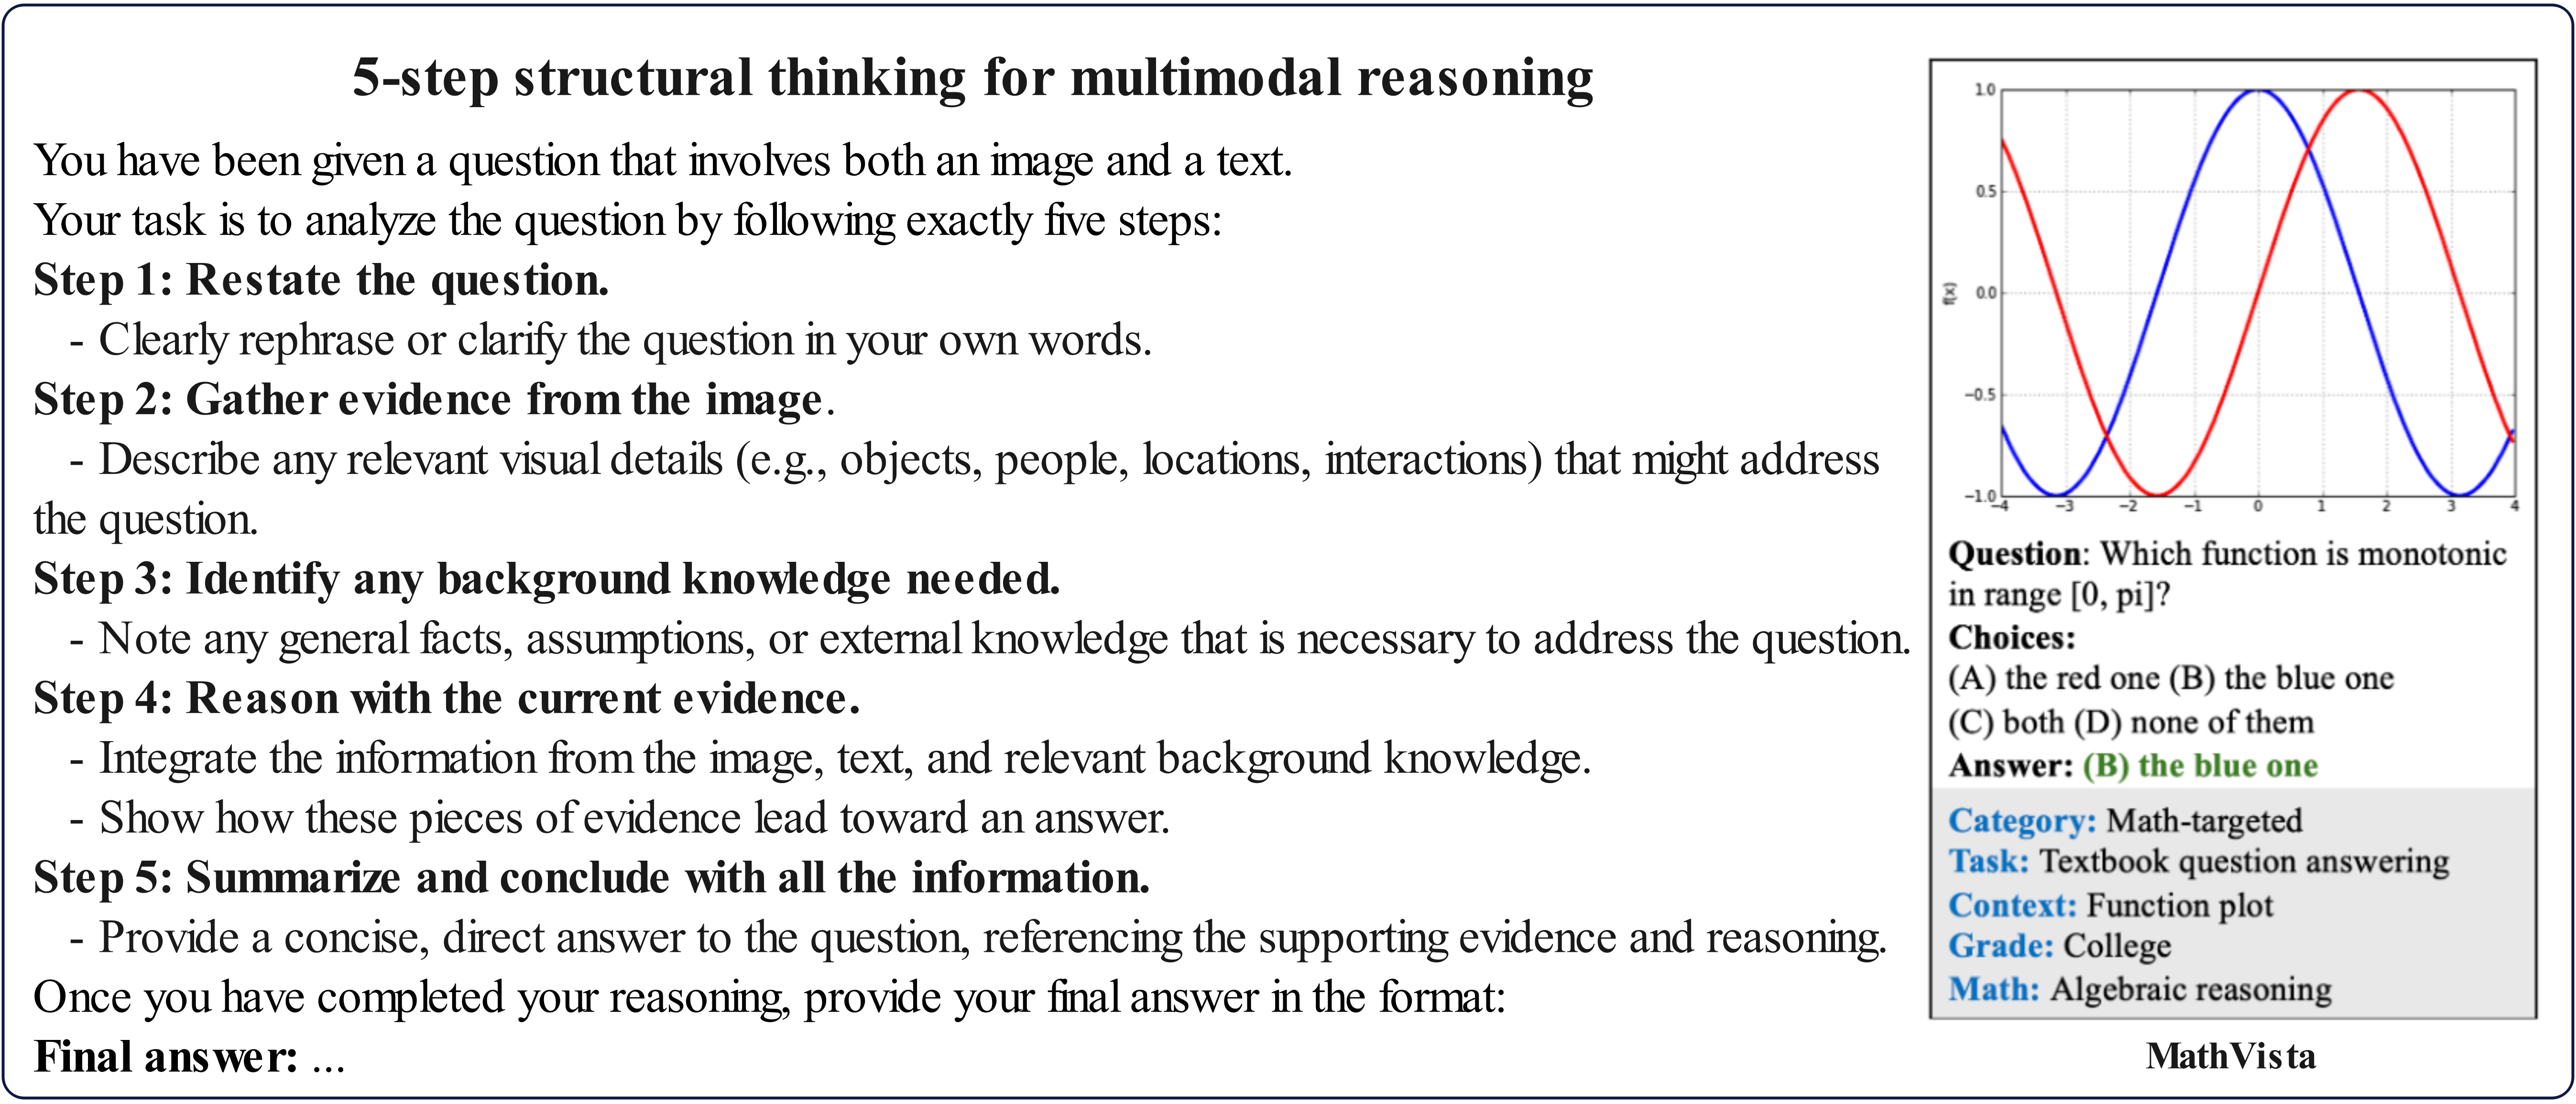
The image is a composite instructional graphic. The left side contains a textual description of a five-step reasoning framework. The right side contains a mathematical function plot and a corresponding multiple-choice question with metadata, serving as an example of the framework's application. The overall purpose is to illustrate a structured method for solving problems that integrate visual and textual information.
### Components/Axes
**Left Panel - Textual Framework:**
* **Title:** "5-step structural thinking for multimodal reasoning"
* **Introductory Text:** "You have been given a question that involves both an image and a text. Your task is to analyze the question by following exactly five steps:"
* **Step 1:** "Step 1: **Restate the question.**"
* Sub-point: "- Clearly rephrase or clarify the question in your own words."
* **Step 2:** "Step 2: **Gather evidence from the image.**"
* Sub-point: "- Describe any relevant visual details (e.g., objects, people, locations, interactions) that might address the question."
* **Step 3:** "Step 3: **Identify any background knowledge needed.**"
* Sub-point: "- Note any general facts, assumptions, or external knowledge that is necessary to address the question."
* **Step 4:** "Step 4: **Reason with the current evidence.**"
* Sub-point: "- Integrate the information from the image, text, and relevant background knowledge."
* Sub-point: "- Show how these pieces of evidence lead toward an answer."
* **Step 5:** "Step 5: **Summarize and conclude with all the information.**"
* Sub-point: "- Provide a concise, direct answer to the question, referencing the supporting evidence and reasoning."
* **Final Instruction:** "Once you have completed your reasoning, provide your final answer in the format: **Final answer: ...**"
**Right Panel - Mathematical Example:**
* **Graph (Top Right):**
* **Type:** 2D line plot of two functions.
* **X-axis:** Linear scale, labeled with integers from -4 to 4. Major ticks at every integer.
* **Y-axis:** Linear scale, labeled from -1.0 to 1.0 with increments of 0.5. The axis label is "f(x)" (rotated vertically).
* **Data Series 1 (Red Line):** A smooth, periodic wave. It starts at approximately (0, 1), decreases to a minimum near (-1.57, -1), rises to a maximum near (1.57, 1), and falls again. This visually corresponds to the function `f(x) = cos(x)`.
* **Data Series 2 (Blue Line):** A smooth, periodic wave. It starts at approximately (0, 0), increases to a maximum near (1.57, 1), and falls to a minimum near (4.71, -1). This visually corresponds to the function `f(x) = sin(x)`.
* **Legend:** Not explicitly present. The functions are distinguished solely by color (red and blue).
* **Question & Answer Block (Below Graph):**
* **Question:** "Question: Which function is monotonic in range [0, pi]?"
* **Choices:**
* "(A) the red one"
* "(B) the blue one"
* "(C) both"
* "(D) none of them"
* **Answer:** "Answer: **(B) the blue one**" (The text "(B) the blue one" is highlighted in green).
* **Metadata Block (Below Answer):**
* **Category:** "Math-targeted"
* **Task:** "Textbook question answering"
* **Context:** "Function plot"
* **Grade:** "College"
* **Math:** "Algebraic reasoning"
* **Source Label (Bottom Right Corner):** "MathVista"
### Detailed Analysis
**Textual Content:** The left panel provides a complete, self-contained procedural guide. Each step is clearly numbered and bolded, with explanatory sub-points. The language is instructional and precise.
**Graph Analysis:**
* **Red Line Trend:** The line has a negative slope from x=0 to x≈3.14 (π), indicating a decreasing trend over the interval [0, π]. It is not monotonic over the full visible range [-4, 4] as it changes direction multiple times.
* **Blue Line Trend:** The line has a positive slope from x=0 to x≈1.57 (π/2), then a negative slope from x≈1.57 to x≈4.71 (3π/2). Over the specific interval [0, π], it increases from 0 to π/2 and then decreases from π/2 to π. Therefore, it is **not** monotonic over the entire interval [0, π].
* **Discrepancy Note:** The provided answer "(B) the blue one" contradicts the visual evidence from the graph. Based on standard mathematical definitions and the plotted curves, the red function (cosine) is monotonic (strictly decreasing) on [0, π], while the blue function (sine) is not. This is a critical observation.
### Key Observations
1. **Instructional Design:** The image pairs a general methodology (left) with a concrete example (right), demonstrating the framework in action.
2. **Graph-Answer Contradiction:** The most significant observation is the conflict between the visual data in the graph and the provided answer. The graph shows the blue function is not monotonic on [0, π], yet it is marked as correct.
3. **Metadata Context:** The metadata clarifies this is a college-level algebraic reasoning task from a dataset or system called "MathVista," framed as a "Textbook question answering" task.
4. **Spatial Layout:** The instructional text occupies the majority (left ~65%) of the image. The example is contained in a bordered box on the right (~35%), with the graph at the top and the question/answer/metadata stacked below it.
### Interpretation
This image serves a dual purpose. Primarily, it is a **pedagogical tool** teaching a structured, five-step approach to multimodal reasoning. The framework emphasizes restating the problem, gathering visual evidence, applying background knowledge, reasoning, and concluding.
Secondarily, the included math problem acts as a **case study**. However, the apparent error in the provided answer (stating the blue/sine function is monotonic on [0, π]) creates an interesting subtext. It could be interpreted in several ways:
* It may be an intentional error to test the viewer's critical application of the very framework being taught (i.e., "Step 2: Gather evidence from the image" should lead one to question the given answer).
* It may be a simple mistake in the example material.
* It highlights the importance of the reasoning process (Steps 3 & 4) over passively accepting provided answers, especially when visual evidence contradicts a stated conclusion.
The "MathVista" label suggests this image is part of a larger dataset or benchmark for evaluating AI systems' ability to perform such multimodal reasoning, where correctly identifying such discrepancies would be a key test of capability. The image, therefore, not only teaches a method but also implicitly demonstrates the kind of critical analysis required when human or AI-generated answers must be verified against visual data.
DECODING INTELLIGENCE...