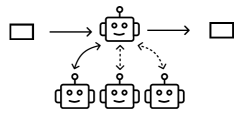
## Diagram: Robot Communication Flow
### Overview
The image is a diagram illustrating a communication flow involving robots. It shows a central robot interacting with two external boxes and three subordinate robots. The communication pathways are indicated by arrows, with some connections being solid and others dashed, suggesting different types of interaction.
### Components/Axes
* **Robots:** Represented by a square body with a smiling face and an antenna on top.
* **Boxes:** Represented by empty squares.
* **Arrows:** Indicate the direction of communication. Solid arrows represent a direct communication, while dashed arrows represent a different type of communication.
### Detailed Analysis
* **Top-Left Box:** A box on the top-left has a solid arrow pointing towards the central robot.
* **Central Robot:** A robot in the center receives input from the top-left box and sends output to the top-right box via solid arrows. It also communicates with three robots below it.
* **Top-Right Box:** A box on the top-right receives a solid arrow from the central robot.
* **Bottom Robots:** Three robots are positioned at the bottom. The central robot communicates with the middle bottom robot via a solid, double-headed arrow. The central robot communicates with the left bottom robot via a solid, curved arrow. The central robot communicates with the right bottom robot via a dashed, curved arrow.
### Key Observations
* The central robot acts as a hub, receiving input from one external source and distributing output to another, while also interacting with a group of subordinate robots.
* The use of solid and dashed arrows suggests different types or priorities of communication.
### Interpretation
The diagram likely represents a hierarchical communication system. The central robot could be a controller or coordinator, receiving instructions from an external source (top-left box), processing them, and then distributing tasks or information to the subordinate robots (bottom robots). The output to the top-right box could represent feedback or results of the tasks performed. The dashed arrow might indicate a less critical or less frequent communication channel. The solid, double-headed arrow between the central robot and the middle bottom robot suggests a two-way communication or feedback loop.