## Diagram: Evolution of Step-by-step Construction Heuristics for KP
### Overview
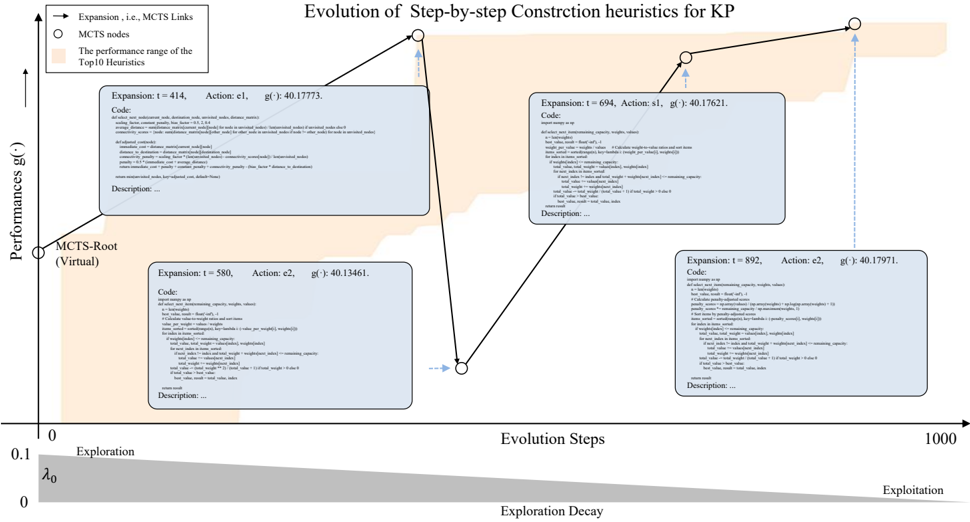
The image is a diagram illustrating the evolution of step-by-step construction heuristics for the Knapsack Problem (KP). It plots the performance (g()) of a search process against the evolution steps. The diagram includes MCTS (Monte Carlo Tree Search) nodes, links representing expansions, and a shaded region indicating the performance range of the top 10 heuristics. The x-axis represents the evolution steps, transitioning from exploration to exploitation. The y-axis represents the performance g().
### Components/Axes
* **Title:** Evolution of Step-by-step Construction heuristics for KP
* **X-axis:** Evolution Steps, ranging from 0 to 1000. The axis is labeled with "Exploration" on the left and "Exploitation" on the right, with "Exploration Decay" indicated below the axis.
* **Y-axis:** Performances g(), ranging from 0 to an implied maximum value (visually estimated to be around 40-41). The axis starts at 0.1 and increases upwards.
* **Legend:** Located in the top-left corner:
* Arrow: Expansion, i.e., MCTS Links
* Circle: MCTS nodes
* Orange Shaded Area: The performance range of the Top 10 Heuristics
* **MCTS-Root (Virtual):** Located on the y-axis at the origin.
* **Exploration Decay:** A gray shaded triangle below the x-axis, indicating the decay of exploration as evolution steps increase. The triangle starts at 0.1 (labeled as λ₀) and decreases to 0 at x=1000.
### Detailed Analysis
The diagram shows a path representing the search process, with nodes indicating MCTS nodes and lines indicating expansions. Each node is associated with a text box containing information about the expansion step, action taken, performance value g(), code snippet, and a description.
* **MCTS-Root (Virtual):** Starting point of the search process.
* **Expansion 1:**
* Expansion: t = 414, Action: e1, g() ≈ 40.17773.
* Code: (A code snippet is provided, but the exact content is not critical for the overall understanding of the diagram.)
* Description: "..."
* Position: Top-left of the chart.
* **Expansion 2:**
* Expansion: t = 580, Action: e2, g() ≈ 40.13461.
* Code: (A code snippet is provided, but the exact content is not critical for the overall understanding of the diagram.)
* Description: "..."
* Position: Bottom-left of the chart.
* **Expansion 3:**
* Expansion: t = 694, Action: s1, g() ≈ 40.17621.
* Code: (A code snippet is provided, but the exact content is not critical for the overall understanding of the diagram.)
* Description: "..."
* Position: Top-right of the chart.
* **Expansion 4:**
* Expansion: t = 892, Action: e2, g() ≈ 40.17971.
* Code: (A code snippet is provided, but the exact content is not critical for the overall understanding of the diagram.)
* Description: "..."
* Position: Bottom-right of the chart.
* **Performance Range of Top 10 Heuristics:** An orange shaded area indicating the range of performance values achieved by the top 10 heuristics. This range appears to be between approximately 40.17 and 40.18.
### Key Observations
* The search process starts with an initial exploration phase, as indicated by the "Exploration Decay" gradient.
* The performance (g()) fluctuates as the search progresses, with some expansions leading to improvements and others leading to declines.
* The performance values of the expansions are relatively close to each other, suggesting that the search process is converging towards a stable solution.
* The performance range of the top 10 heuristics provides a benchmark for evaluating the effectiveness of the search process.
### Interpretation
The diagram illustrates how a step-by-step construction heuristic evolves during a search process for the Knapsack Problem. The search starts with exploration and gradually transitions to exploitation. The performance values (g()) indicate the quality of the solutions found at each step. The proximity of the performance values to the range of the top 10 heuristics suggests that the search process is effective in finding good solutions. The code snippets and descriptions associated with each expansion provide insights into the actions taken at each step. The "Exploration Decay" gradient visually represents the shift from exploration to exploitation as the search progresses.