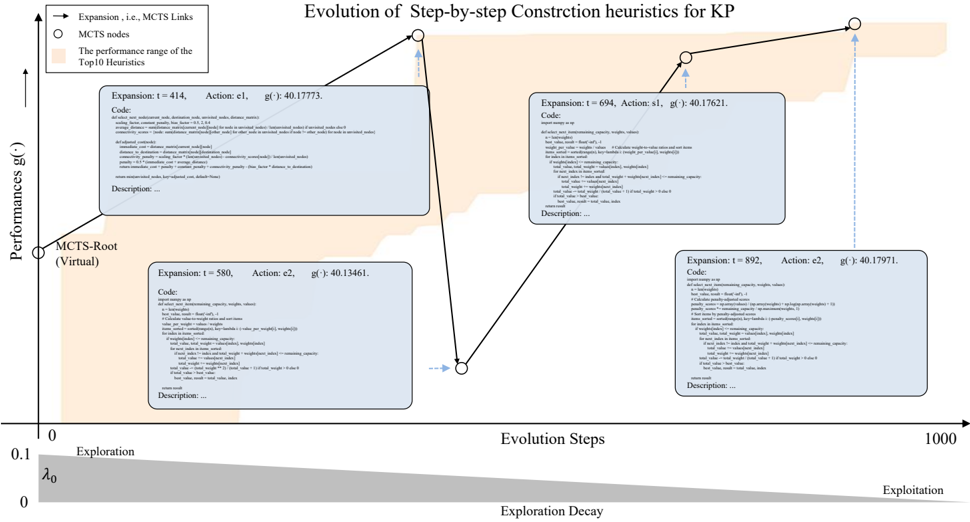
## Diagram: Evolution of Step-by-step Construction Heuristics for KP
### Overview
This image is a technical diagram illustrating the evolution of construction heuristics for the Knapsack Problem (KP) using a Monte Carlo Tree Search (MCTS) process. It plots heuristic performance against evolution steps, showing specific expansion events with associated code and performance metrics. The diagram includes a main performance graph, detailed expansion boxes, a legend, and a secondary axis depicting an exploration-exploitation trade-off.
### Components/Axes
**Main Graph Axes:**
* **Vertical Axis (Y-axis):** Labeled "Performances g(·)". The axis has an arrow pointing upward and numerical markers at `0` and `0.1`. The actual performance values (`g(·)`) listed in the expansion boxes are around 40, indicating the axis may represent a normalized or different scale than the raw scores.
* **Horizontal Axis (X-axis):** Labeled "Evolution Steps". The axis ranges from `0` to `1000`.
**Legend (Top-Left Corner):**
* **Solid Line with Arrow:** "Expansion, i.e., MCTS Links"
* **White Circle with Black Outline:** "MCTS nodes"
* **Shaded Orange Area:** "The performance range of the Top10 Heuristics"
**Secondary Bottom Axis:**
* **Label:** "Exploration Decay"
* **Gradient Bar:** Transitions from "Exploration" (left) to "Exploitation" (right).
* **Parameter:** `λ₀` is marked near the left (Exploration) end.
**Expansion Boxes (4 total):** Each box is connected by a dashed blue arrow to a specific MCTS node on the graph. They contain structured data:
1. **Expansion Details:** `t` (time/step), `Action`, `g(·)` (performance value).
2. **Code:** A Python code snippet implementing a heuristic for the Knapsack Problem.
3. **Description:** A placeholder field ("Description: ...").
### Detailed Analysis
**Data Series and Trends:**
The primary data series is the black line connecting MCTS nodes, representing the performance trajectory of the selected heuristic over evolution steps.
* **Trend Verification:** The line starts at a virtual root node, dips to a lower performance at step 580, then rises to a higher performance at step 694, and reaches its highest point at step 892. The overall trend from step 580 onward is upward.
**Expansion Node Data (in chronological order of `t`):**
1. **Node 1 (Top-Left, connected to MCTS-Root):**
* **Position:** Top-left quadrant of the main graph.
* **Data:** `Expansion: t = 414, Action: c1, g(·): 40.17773`
* **Code Snippet:** Defines a function `solve_kp` using a dynamic programming approach for the 0/1 Knapsack Problem.
2. **Node 2 (Bottom-Left):**
* **Position:** Lower-left quadrant, representing a performance dip.
* **Data:** `Expansion: t = 580, Action: c2, g(·): 40.13461`
* **Code Snippet:** Implements a different heuristic, possibly a greedy or randomized construction method.
3. **Node 3 (Top-Right):**
* **Position:** Upper-right quadrant, showing recovery and improvement.
* **Data:** `Expansion: t = 694, Action: s1, g(·): 40.17621`
* **Code Snippet:** Contains another heuristic variant, with comments indicating parameter tuning.
4. **Node 4 (Bottom-Right, Highest Point):**
* **Position:** Far right, at the highest vertical point on the graph.
* **Data:** `Expansion: t = 892, Action: c2, g(·): 40.17971`
* **Code Snippet:** Shows a heuristic that appears to be a refined version of the one in Node 2.
**Performance Range (Shaded Area):**
The orange shaded area, representing the "performance range of the Top10 Heuristics," spans horizontally across the graph. Its vertical width fluctuates, indicating the variance in performance among the top heuristics at different evolution steps. The MCTS node line generally stays within or near the upper boundary of this shaded range.
### Key Observations
1. **Performance Fluctuation:** The MCTS process does not show monotonic improvement. There is a notable performance drop at `t=580` before recovery and subsequent improvement.
2. **Highest Performance:** The final recorded expansion at `t=892` achieves the highest `g(·)` value of `40.17971`.
3. **Action Types:** Three distinct action labels are used: `c1`, `c2`, and `s1`, suggesting different classes or families of construction heuristics being explored.
4. **Exploration-Exploitation Trade-off:** The bottom axis explicitly frames the evolution process as a shift from exploration (trying diverse heuristics) to exploitation (refining the best ones), controlled by a decay parameter `λ₀`.
5. **Code as Data:** The inclusion of actual code snippets within the diagram is a distinctive feature, directly linking the abstract performance metric to concrete algorithmic implementations.
### Interpretation
This diagram visualizes the search process of an MCTS algorithm tasked with discovering effective construction heuristics for the Knapsack Problem. The `g(·)` values likely represent the quality of solutions produced by a heuristic, with higher values being better.
The process begins with exploration (left side), where the algorithm tries different heuristic actions (`c1`, `c2`), leading to variable performance. The dip at `t=580` suggests the exploration of a sub-optimal heuristic path. However, the algorithm learns and adapts, as evidenced by the subsequent rise in performance. The final, highest-performing node at `t=892` indicates successful exploitation, where the algorithm has converged on a refined heuristic (a variant of action `c2`) that outperforms earlier attempts.
The shaded "Top10 Heuristics" range serves as a benchmark. The fact that the MCTS trajectory operates near its upper bound demonstrates the algorithm's effectiveness in identifying heuristics competitive with the best-known methods. The exploration-exploitation gradient at the bottom provides the theoretical context for the observed trajectory: the algorithm's behavior shifts from broad search to focused refinement as evolution steps increase.
**Language Note:** All text in the diagram is in English. A minor typo is present in the title: "Constretion" should be "Construction."