## Diagram: Evolution of Step-by-step Construction Heuristics for KP
### Overview
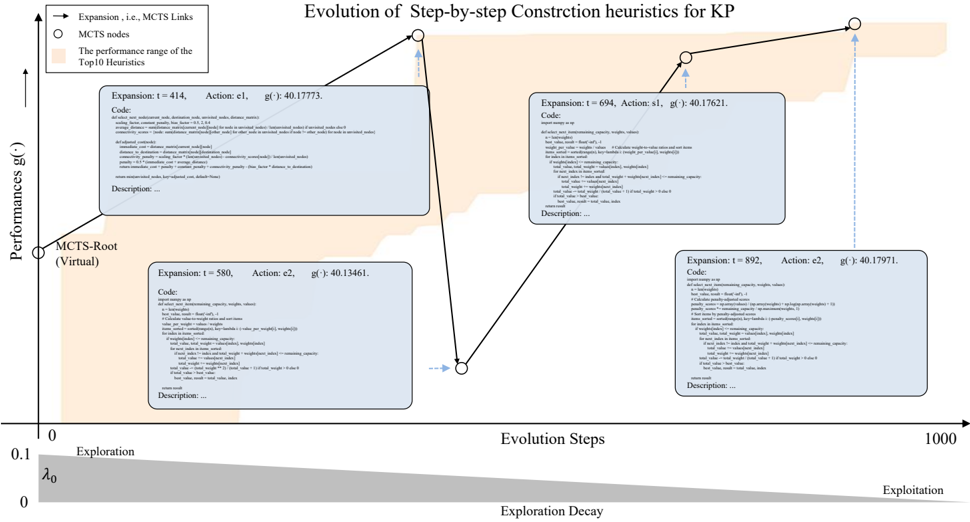
The diagram illustrates the evolution of heuristics for the Knapsack Problem (KP) over 1000 evolution steps. It tracks performance (g') against exploration decay (λ₀) and includes nodes representing key heuristic construction milestones. The graph combines a performance curve with annotated decision points and a shaded exploration/exploitation phase.
### Components/Axes
- **Y-axis**: Performance (g') - logarithmic scale from 0 to 1000
- **X-axis**: Evolution Steps (0 to 1000) with λ₀ parameter (exploration decay)
- **Legend**:
- Blue rectangles: Expansion events (MCTS links)
- Orange circles: MCTS nodes
- Shaded orange area: Top 10 Heuristics performance range
- **Key Elements**:
- Nodes with timestamps (t=414, 580, 694, 892)
- Action labels (e1, e2, s1)
- Performance values (g'=40.17773, 40.13461, 40.17621, 40.17971)
- Code snippets and descriptions at each node
### Detailed Analysis
1. **Initial State (t=0)**:
- MCTS-Root node at performance g'=0
- λ₀=1 (full exploration)
2. **First Expansion (t=414)**:
- Action: e1
- Performance: g'=40.17773
- Code: Contains initialization of MCTS links and node structures
3. **Second Expansion (t=580)**:
- Action: e2
- Performance: g'=40.13461 (temporary dip)
- Code: Implements node expansion with virtual root
4. **Third Expansion (t=694)**:
- Action: s1
- Performance: g'=40.17621
- Code: Shows heuristic selection logic with pruning
5. **Final Expansion (t=892)**:
- Action: e2
- Performance: g'=40.17971 (peak)
- Code: Final heuristic refinement with MCTS integration
6. **Exploration/Exploitation Transition**:
- Shaded area spans λ₀=0 to 1000
- Exploration dominates early steps (λ₀=1)
- Exploitation phase begins after t=500 (λ₀=0.5)
### Key Observations
- Performance plateaus around g'=40.17-40.18 after initial exploration
- Temporary performance dip at t=580 suggests suboptimal action
- MCTS nodes appear at critical decision points (t=0, 414, 694)
- Top 10 Heuristics range remains consistent (g'=40.13-40.18)
- Exploration decay follows exponential curve (λ₀=1 → 0)
### Interpretation
The diagram demonstrates a hybrid approach combining MCTS-guided exploration with heuristic refinement. The initial exploration phase (λ₀=1) allows broad search space coverage, while subsequent exploitation focuses on promising heuristics. The performance plateau suggests convergence to near-optimal solutions, with MCTS nodes acting as checkpoints for heuristic validation. The temporary dip at t=580 highlights the importance of action selection in evolutionary algorithms. The final performance value (g'=40.17971) represents the best heuristic found after 892 steps, indicating effective balance between exploration and exploitation.