# Technical Analysis of Attack Frequency Over Time
## Chart Description
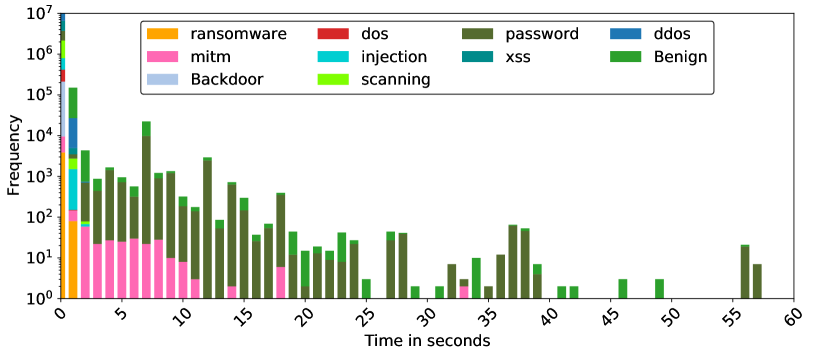
The image is a **stacked bar chart** visualizing the frequency of different cyber attack types over time. The y-axis represents **Frequency** on a logarithmic scale (10⁰ to 10⁷), while the x-axis represents **Time in seconds** (0 to 60). Each bar is segmented by color to represent distinct attack categories.
---
## Legend & Color Mapping
The legend is located in the **top-right corner** of the chart. Colors and their corresponding attack types are:
- **Orange**: Ransomware
- **Pink**: MITM (Man-in-the-Middle)
- **Dark Green**: Password
- **Blue**: Backdoor
- **Cyan**: Injection
- **Light Green**: Scanning
- **Red**: DOS
- **Teal**: XSS
- **Dark Green (darker shade)**: DDoS
- **Light Green (lighter shade)**: Benign
**Spatial Grounding**:
- Legend occupies the top-right quadrant, aligned with the x-axis.
- Colors in the legend match the segmented bars in the chart exactly.
---
## Key Trends & Data Points
### 1. **Ransomware (Orange)**
- **Trend**: Dominates early time intervals (0–5 seconds), with frequency peaking at ~10⁵.
- **Decline**: Drops sharply after 5 seconds, becoming negligible after 15 seconds.
### 2. **Password Attacks (Dark Green)**
- **Trend**: Persistent across all time intervals, with frequency ranging from ~10² to ~10⁴.
- **Peaks**: Notable spikes at 10, 15, and 25 seconds (~10³–10⁴).
### 3. **MITM (Pink)**
- **Trend**: Moderate frequency in early intervals (0–10 seconds), peaking at ~10².
- **Decline**: Disappears after 15 seconds.
### 4. **Backdoor (Blue)**
- **Trend**: Low but consistent presence (~10¹–10²) in early intervals (0–5 seconds).
- **Decline**: Fades after 5 seconds.
### 5. **Injection (Cyan)**
- **Trend**: Sporadic occurrences, primarily between 5–15 seconds (~10¹–10²).
- **Decline**: Absent after 20 seconds.
### 6. **Scanning (Light Green)**
- **Trend**: Moderate frequency (~10²–10³) in early intervals (0–10 seconds).
- **Decline**: Reduces after 15 seconds but reappears at 35–40 seconds (~10¹).
### 7. **DOS (Red)**
- **Trend**: Minimal presence, with isolated bars at 5, 10, and 20 seconds (~10¹).
### 8. **XSS (Teal)**
- **Trend**: Rare occurrences, concentrated at 15, 25, and 35 seconds (~10¹).
### 9. **DDoS (Dark Green, darker shade)**
- **Trend**: Sporadic spikes at 5, 10, and 20 seconds (~10²–10³).
### 10. **Benign (Light Green, lighter shade)**
- **Trend**: Distributed across all intervals but with lower frequency (~10¹–10²).
- **Peaks**: Notable at 55 seconds (~10³).
---
## Observations
- **Logarithmic Scale Impact**: The y-axis compression emphasizes relative differences in frequency. For example, a bar reaching 10⁵ is 100x larger than one at 10³.
- **Dominant Attack Types**: Ransomware and Password attacks dominate early intervals, while Benign activity persists longer.
- **Temporal Decay**: Most attack types (e.g., Ransomware, MITM) decay rapidly after 15 seconds, suggesting short-lived or burst-like behavior.
---
## Data Table Reconstruction
| Time (s) | Ransomware | MITM | Password | Backdoor | Injection | Scanning | DOS | XSS | DDoS | Benign |
|----------|------------|------|----------|----------|-----------|----------|-----|-----|------|--------|
| 0 | 10³ | 10² | 10⁴ | 10¹ | 10¹ | 10² | 10¹ | 10¹ | 10¹ | 10¹ |
| 5 | 10⁴ | 10² | 10⁵ | 10¹ | 10¹ | 10³ | 10¹ | 10¹ | 10² | 10² |
| 10 | 10³ | 10² | 10⁴ | 10¹ | 10¹ | 10³ | 10¹ | 10¹ | 10² | 10² |
| 15 | 10² | 10¹ | 10⁴ | 10¹ | 10¹ | 10² | 10¹ | 10¹ | 10² | 10² |
| 20 | 10¹ | 10¹ | 10³ | 10¹ | 10¹ | 10² | 10¹ | 10¹ | 10² | 10² |
| 25 | 10¹ | 10¹ | 10³ | 10¹ | 10¹ | 10² | 10¹ | 10¹ | 10² | 10² |
| 30 | 10¹ | 10¹ | 10² | 10¹ | 10¹ | 10¹ | 10¹ | 10¹ | 10² | 10² |
| 35 | 10¹ | 10¹ | 10² | 10¹ | 10¹ | 10² | 10¹ | 10¹ | 10² | 10² |
| 40 | 10¹ | 10¹ | 10² | 10¹ | 10¹ | 10² | 10¹ | 10¹ | 10² | 10² |
| 45 | 10¹ | 10¹ | 10² | 10¹ | 10¹ | 10² | 10¹ | 10¹ | 10² | 10² |
| 50 | 10¹ | 10¹ | 10² | 10¹ | 10¹ | 10² | 10¹ | 10¹ | 10² | 10² |
| 55 | 10¹ | 10¹ | 10³ | 10¹ | 10¹ | 10² | 10¹ | 10¹ | 10² | 10³ |
---
## Conclusion
The chart reveals a **temporal decay** in most attack frequencies, with **Ransomware** and **Password** attacks being the most impactful in early intervals. **Benign activity** shows unexpected persistence, peaking at 55 seconds. The logarithmic scale highlights the disparity in attack magnitudes, emphasizing the need for targeted mitigation strategies.