## Bar Chart: KV Cache Length Comparison (Transformers vs DynTS)
### Overview
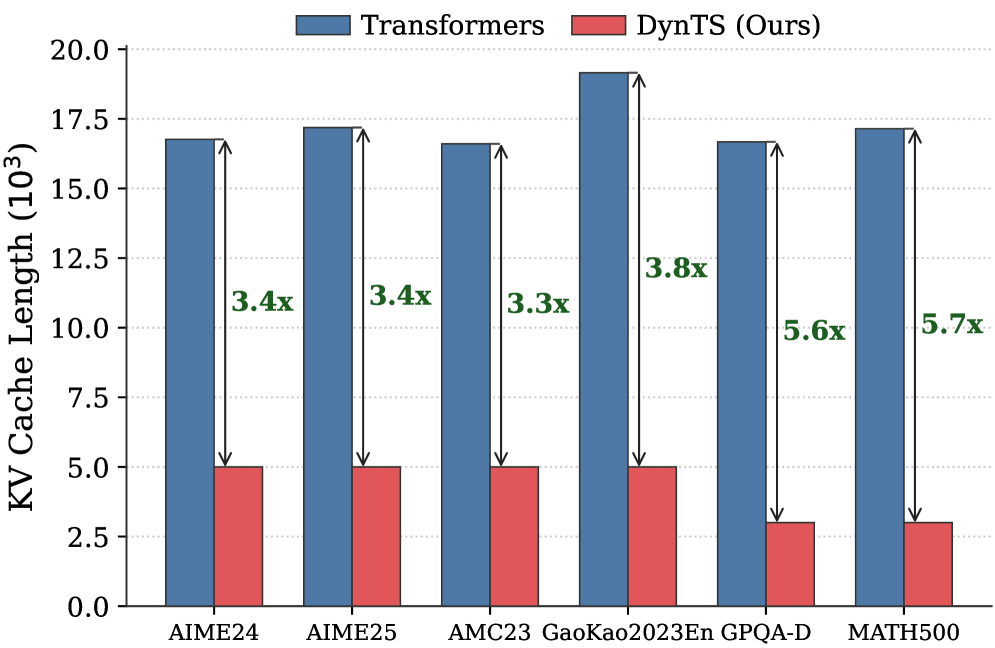
The chart compares KV Cache Length (in 10³) between two models: Transformers (blue bars) and DynTS (red bars) across six datasets. Each bar pair includes a multiplier indicating the relative efficiency of DynTS compared to Transformers.
### Components/Axes
- **Y-axis**: KV Cache Length (10³), logarithmic scale from 0 to 20.
- **X-axis**: Datasets: AIME24, AIME25, AMC23, GaoKao2023En, GPQA-D, MATH500.
- **Legend**:
- Blue = Transformers
- Red = DynTS (Ours)
- **Annotations**: Multipliers (e.g., "3.4x") above each bar pair, showing DynTS efficiency relative to Transformers.
### Detailed Analysis
1. **AIME24**:
- Transformers: ~17.0 (10³)
- DynTS: ~5.0 (10³)
- Multiplier: 3.4x
2. **AIME25**:
- Transformers: ~17.5 (10³)
- DynTS: ~5.0 (10³)
- Multiplier: 3.4x
3. **AMC23**:
- Transformers: ~17.0 (10³)
- DynTS: ~5.0 (10³)
- Multiplier: 3.3x
4. **GaoKao2023En**:
- Transformers: ~19.5 (10³)
- DynTS: ~5.0 (10³)
- Multiplier: 3.8x
5. **GPQA-D**:
- Transformers: ~17.0 (10³)
- DynTS: ~3.0 (10³)
- Multiplier: 5.6x
6. **MATH500**:
- Transformers: ~17.5 (10³)
- DynTS: ~3.0 (10³)
- Multiplier: 5.7x
### Key Observations
- **Transformers** consistently show higher KV Cache Lengths (16.5–19.5 × 10³) across all datasets.
- **DynTS** demonstrates significantly lower KV Cache Lengths (3.0–5.0 × 10³), with multipliers ranging from 3.3x to 5.7x.
- **GPQA-D** and **MATH500** exhibit the largest efficiency gains (5.6x and 5.7x), suggesting DynTS is particularly effective for these tasks.
- DynTS values drop below 4 × 10³ in GPQA-D and MATH500, while Transformers remain above 17 × 10³.
### Interpretation
The data highlights DynTS's superior efficiency in KV Cache Length compared to traditional Transformers. The varying multipliers indicate task-dependent performance: GPQA-D and MATH500 benefit most from DynTS optimizations, likely due to their complexity or structure. This suggests DynTS could reduce computational overhead in memory-intensive applications, though further analysis is needed to confirm causality. The logarithmic y-axis emphasizes the scale disparity, underscoring DynTS's potential for resource-constrained environments.