TECHNICAL ASSET FINGERPRINT
df76fbd1dc744c8227babf74
Click to view fullscreen
Press ESC or click to close
FOUND IN PAPERS
EXPERT: gemini-2.0-flash VERSION 1
RUNTIME: nugit/gemini/gemini-2.0-flash
INTEL_VERIFIED
## Diagram: Mathematical Framework for Intelligent Event Orchestration
### Overview
The image is a layered diagram representing a mathematical framework for intelligent event orchestration (AIEO). It depicts a hierarchical structure with five layers, each responsible for a specific aspect of the orchestration process. The diagram includes mathematical formulas, algorithms, and technologies used in each layer.
### Components/Axes
The diagram is structured into five layers, each represented by a colored rectangle with a descriptive title:
* **Layer 1:** Control & Orchestration Plane (Red rectangle)
* Multi-Phase Optimization Algorithm
* O(t) = arg min<sub>θ</sub> L(θ, S<sub>t</sub>, A<sub>t</sub>, H<sub>t</sub>)
* **Layer 2:** Predictive Intelligence Layer (Blue rectangle)
* Workload Prediction Engine
* ŷ<sub>t</sub> = Σ<sup>n</sup><sub>i=1</sub> w<sub>i</sub>(t) ⋅ f<sub>i</sub>(x<sub>t-k:t</sub>)
* Ensemble: ARIMA + Prophet + LSTM
* Resource Allocation Optimizer
* π<sup>\*</sup>(θ) = arg max<sub>π</sub> E[Σ<sub>t</sub> γ<sup>t</sup> R<sub>t</sub>]
* PPO + Multi-objective GA
* Time Series Forecasting:
* X<sub>t</sub> = φ<sub>1</sub>X<sub>t-1</sub> + ... + φ<sub>p</sub>X<sub>t-p</sub> + ε<sub>t</sub>
* ARIMA(p,d,q) model
* Policy Gradient:
* ∇<sub>θ</sub>J(θ) = E[∇<sub>θ</sub> log π<sub>θ</sub>(a|s)A(s, a)]
* Actor-Critic framework
* **Layer 3:** Dynamic Adaptation Layer (Green rectangle)
* Adaptive Routing & Resource Management
* Q<sup>\*</sup>(s, a) = E[r + γ max<sub>a'</sub> Q<sup>\*</sup>(s', a') | s, a]
* Multi-objective Optimization:
* min{f<sub>1</sub>(x), f<sub>2</sub>(x), ..., f<sub>k</sub>(x)}
* subject to: g<sub>i</sub>(x) ≤ 0
* Graph Neural Networks:
* h<sub>v</sub><sup>(l+1)</sup> = σ(W<sup>(l)</sup> ⋅ AGG<sup>(l)</sup>({h<sub>u</sub><sup>(l)</sup> : u ∈ N(v)}))
* **Layer 4:** Framework Integration Layer (Purple rectangle)
* Apache Kafka
* λ<sub>max</sub> = 1.2 × 10<sup>6</sup> msg/sec
* Apache Pulsar
* λ<sub>max</sub> = 9.5 × 10<sup>5</sup> msg/sec
* RabbitMQ
* λ<sub>max</sub> = 4.5 × 10<sup>5</sup> msg/sec
* NATS JetStream
* L<sub>p95</sub> = 15.3 ms
* μ = 8 × 10<sup>5</sup>
* Redis Streams
* L<sub>p95</sub> = 8.7 ms
* σ<sup>2</sup> = 0.92
* EventBridge
* O(t) = α ⋅ N(t)
* elastic scaling
* Pub/Sub
* P(delivery) = 1 - ε
* global distribution
* Knative
* scale(0, ∞)
* container-native
* **Layer 5:** Application Workload Layer (Yellow rectangle)
* W1: E-commerce
* W<sub>1</sub> : λ ~ P(μ<sub>1</sub>)
* ACID requirements
* W2: IoT Telem
* W<sub>2</sub> : burst(α, ...)
* fault-tolerant
* W3: AI Inference
* W<sub>3</sub> : var(T<sub>proc</sub>)
* variable latency
### Detailed Analysis or ### Content Details
* **Layer 1:** The Control & Orchestration Plane uses a Multi-Phase Optimization Algorithm, represented by the equation O(t) = arg min<sub>θ</sub> L(θ, S<sub>t</sub>, A<sub>t</sub>, H<sub>t</sub>).
* **Layer 2:** The Predictive Intelligence Layer consists of a Workload Prediction Engine and a Resource Allocation Optimizer. The Workload Prediction Engine uses an ensemble of ARIMA, Prophet, and LSTM models. The Resource Allocation Optimizer uses PPO and Multi-objective GA.
* **Layer 3:** The Dynamic Adaptation Layer uses Adaptive Routing & Resource Management, represented by the equation Q<sup>\*</sup>(s, a) = E[r + γ max<sub>a'</sub> Q<sup>\*</sup>(s', a') | s, a]. It also incorporates Graph Neural Networks.
* **Layer 4:** The Framework Integration Layer integrates various messaging and streaming technologies, including Apache Kafka (λ<sub>max</sub> = 1.2 × 10<sup>6</sup> msg/sec), Apache Pulsar (λ<sub>max</sub> = 9.5 × 10<sup>5</sup> msg/sec), RabbitMQ (λ<sub>max</sub> = 4.5 × 10<sup>5</sup> msg/sec), NATS JetStream (L<sub>p95</sub> = 15.3 ms, μ = 8 × 10<sup>5</sup>), Redis Streams (L<sub>p95</sub> = 8.7 ms, σ<sup>2</sup> = 0.92), EventBridge (O(t) = α ⋅ N(t)), Pub/Sub (P(delivery) = 1 - ε), and Knative (scale(0, ∞)).
* **Layer 5:** The Application Workload Layer consists of three workload types: E-commerce (W1), IoT Telem (W2), and AI Inference (W3).
### Key Observations
* The diagram illustrates a layered architecture for intelligent event orchestration.
* Each layer is responsible for a specific aspect of the orchestration process.
* The diagram includes mathematical formulas, algorithms, and technologies used in each layer.
* The Framework Integration Layer (Layer 4) provides specific performance metrics (λ<sub>max</sub>, L<sub>p95</sub>, μ, σ<sup>2</sup>) for different technologies.
### Interpretation
The diagram presents a comprehensive framework for intelligent event orchestration, integrating predictive intelligence, dynamic adaptation, and various messaging technologies. The layered architecture allows for modularity and scalability. The use of mathematical formulas and algorithms provides a formal basis for the orchestration process. The inclusion of performance metrics for different technologies in Layer 4 allows for informed decision-making when selecting the appropriate technologies for a given application. The framework aims to optimize event processing and resource allocation in complex systems.
DECODING INTELLIGENCE...
EXPERT: nano-banana-pro VERSION 1
RUNTIME: nugit/gemini/nano-banana-pro-preview
INTEL_VERIFIED
## Diagram: AIEO: Mathematical Framework for Intelligent Event Orchestration
### Overview
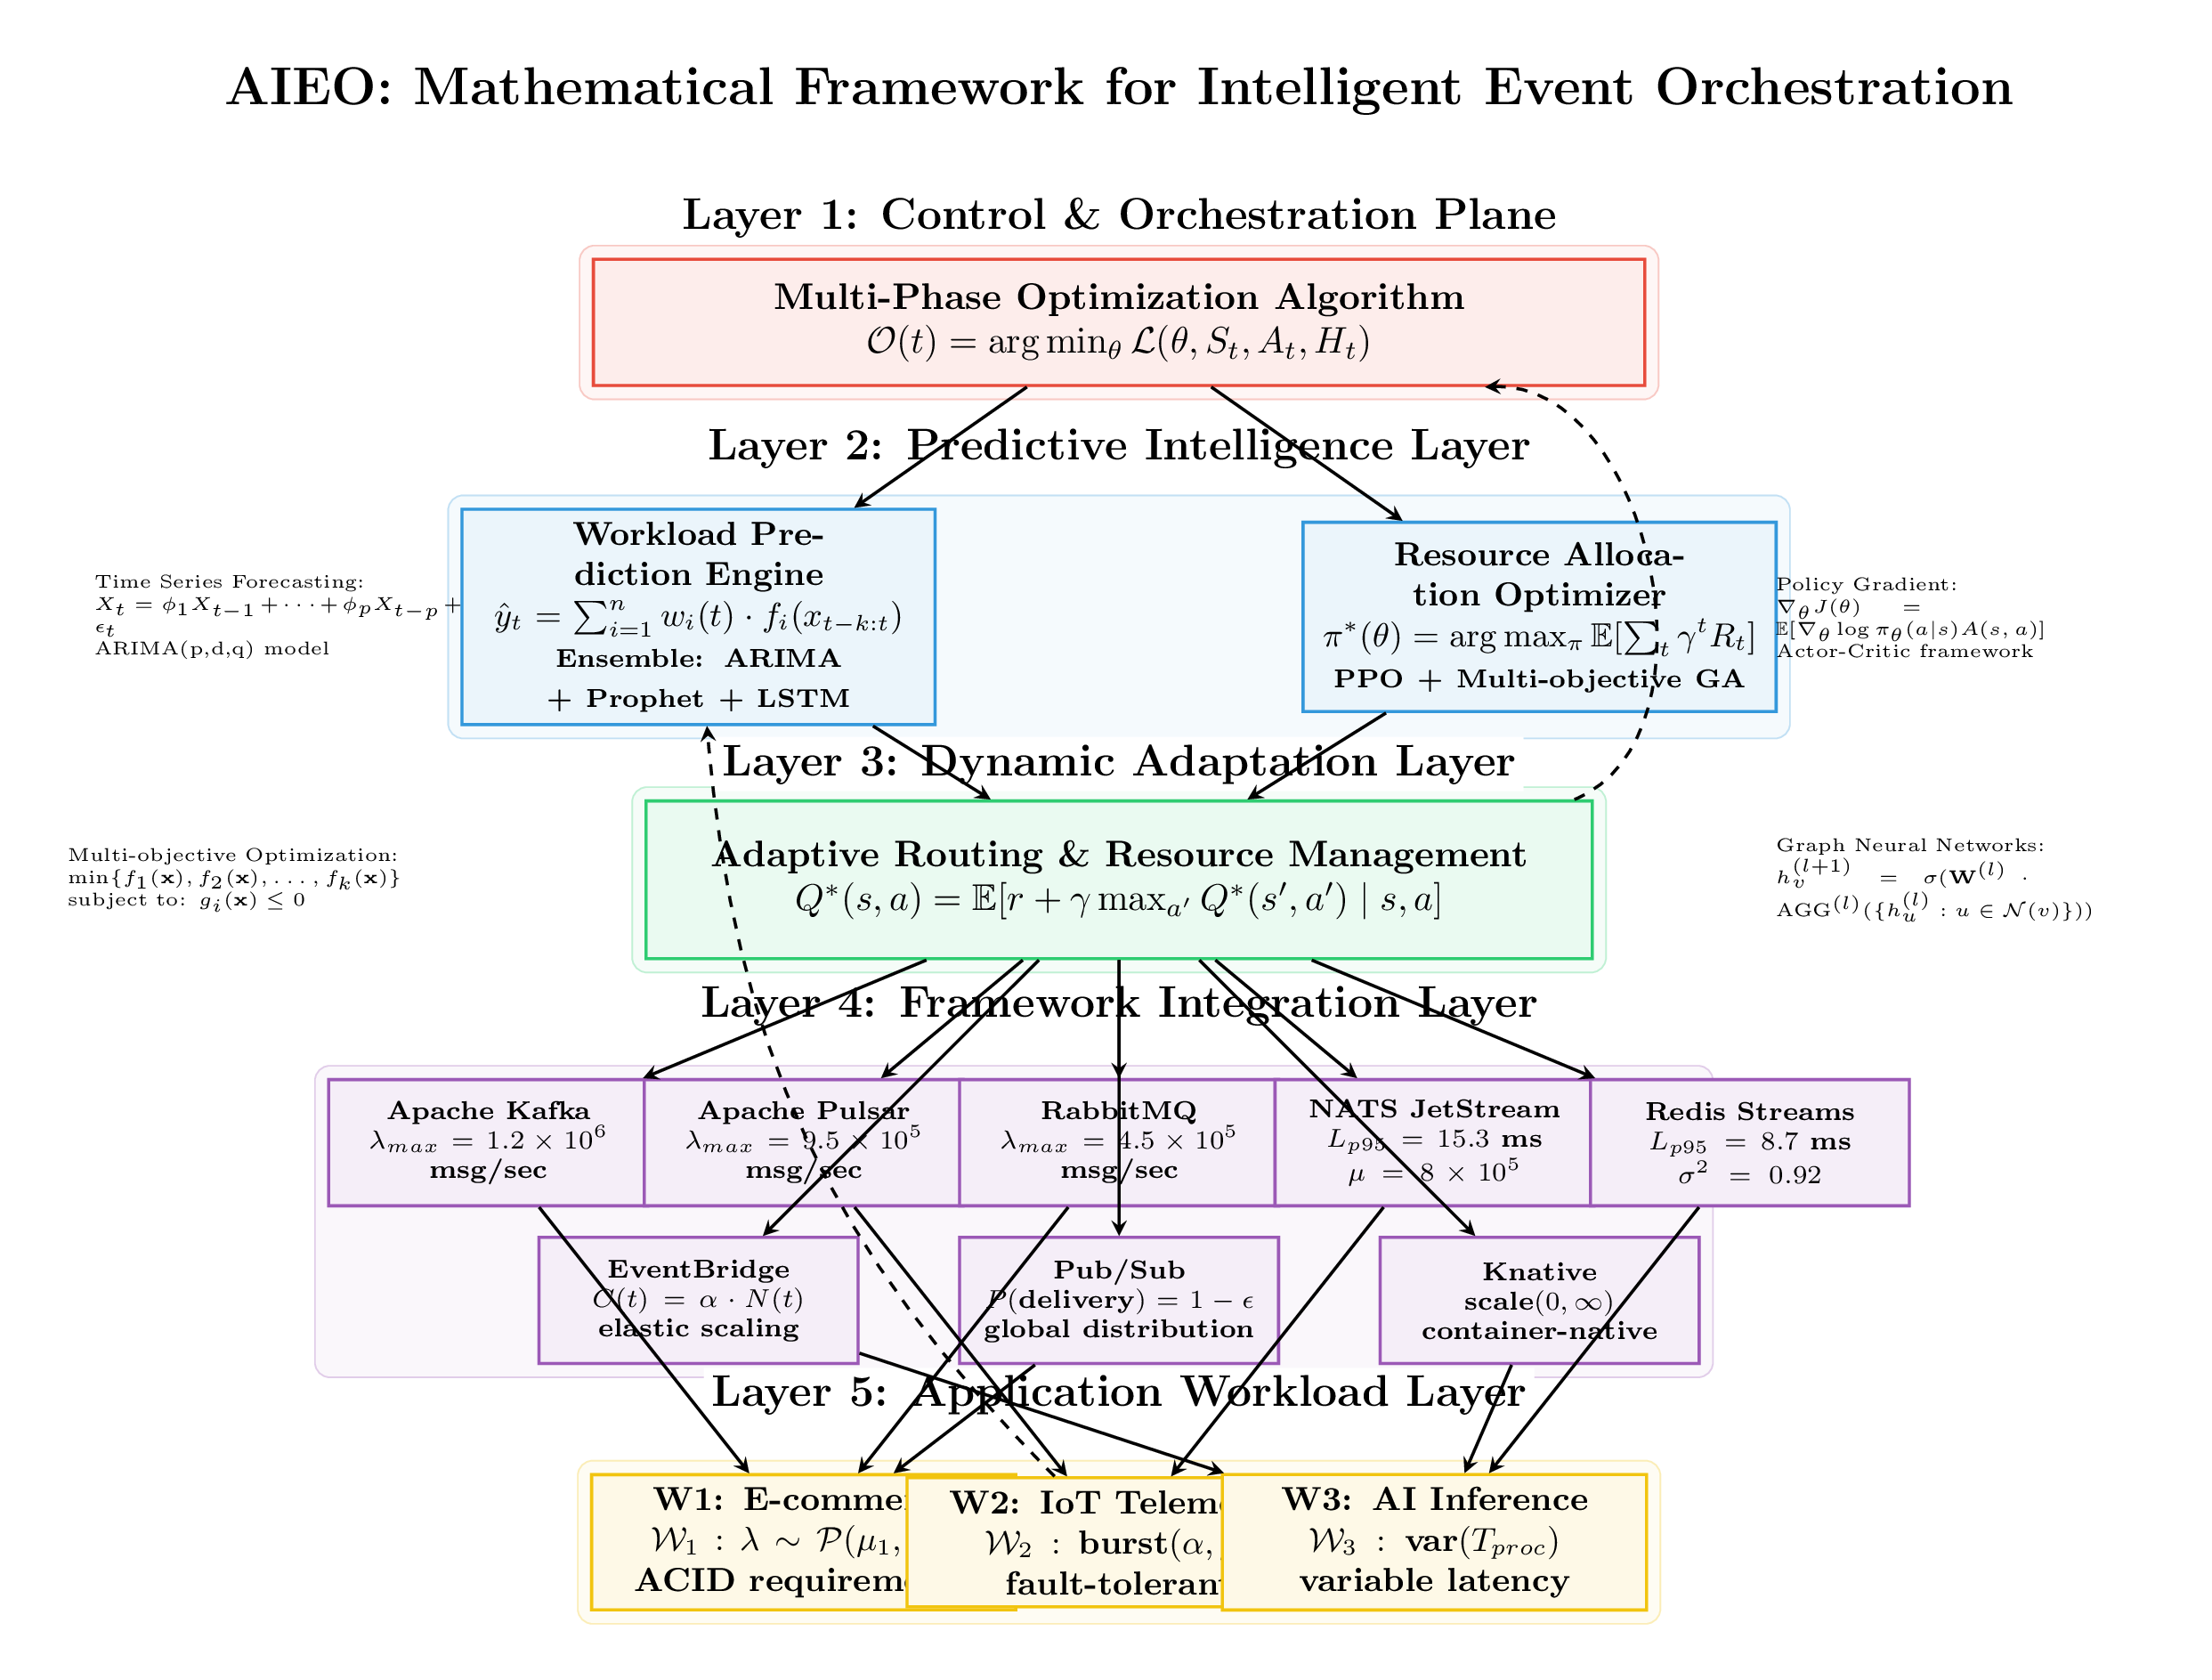
This diagram illustrates a five-layered mathematical framework designed for the intelligent orchestration of events. It details a hierarchical system that moves from high-level control and optimization down to specific infrastructure integration and application workloads. The framework employs various mathematical models, machine learning techniques, and control theories to optimize performance, resource allocation, and adaptation in dynamic environments.
### Components and Flow
The diagram is structured into five distinct horizontal layers, each represented by a specific color and function. Arrows indicate the flow of information and control signals.
* **Layer Structure:**
* **Layer 1 (Red):** Control & Orchestration Plane (Top)
* **Layer 2 (Blue):** Predictive Intelligence Layer
* **Layer 3 (Green):** Dynamic Adaptation Layer
* **Layer 4 (Purple):** Framework Integration Layer
* **Layer 5 (Yellow):** Application Workload Layer (Bottom)
* **Flow Direction:**
* **Top-Down (Control):** Solid black arrows indicate control signals and decisions flowing from Layer 1 down through Layers 2, 3, and 4 to manage the workloads in Layer 5.
* **Bottom-Up (Data/Feedback):** Solid black arrows from Layer 5 to Layer 4 indicate workload data flowing upwards.
* **Feedback Loops:** Dashed black arrows indicate feedback loops.
* From Layer 3 up to Layer 2.
* From Layer 3 up to Layer 1.
* From Layer 2 up to Layer 1.
### Detailed Analysis of Layers
#### Layer 1: Control & Orchestration Plane
* **Component:** A single central red box.
* **Title:** Multi-Phase Optimization Algorithm
* **Formula:** $\mathcal{O}(t) = \arg \min_{\theta} \mathcal{L}(\theta, S_t, A_t, H_t)$
* **Description:** This layer represents the overarching governing algorithm that minimizes a loss function $\mathcal{L}$ based on parameters $\theta$, current state $S_t$, actions $A_t$, and historical data $H_t$.
#### Layer 2: Predictive Intelligence Layer
* **Components:** Two blue boxes flanked by explanatory text.
* **Left Box: Workload Prediction Engine**
* **Formula:** $\hat{y}_t = \sum_{i=1}^{n} w_i(t) \cdot f_i(x_{t-k:t})$
* **Text:** Ensemble: ARIMA + Prophet + LSTM
* **Side Note (Left):** Time Series Forecasting: $X_t = \phi_1 X_{t-1} + \dots + \phi_p X_{t-p} + \epsilon_t$. ARIMA(p,d,q) model.
* **Right Box: Resource Allocation Optimizer**
* **Formula:** $\pi^*(\theta) = \arg \max_{\pi} \mathbb{E}[\sum_t \gamma^t R_t]$
* **Text:** PPO + Multi-objective GA
* **Side Note (Right):** Policy Gradient: $\nabla_\theta J(\theta) = \mathbb{E}[\nabla_\theta \log \pi_\theta(a|s) A(s, a)]$. Actor-Critic framework.
#### Layer 3: Dynamic Adaptation Layer
* **Component:** A single central green box with a dashed border.
* **Title:** Adaptive Routing & Resource Management
* **Formula:** $Q^*(s, a) = \mathbb{E}[r + \gamma \max_{a'} Q^*(s', a') \mid s, a]$
* **Side Note (Left):** Multi-objective Optimization: $\min \{ f_1(\mathbf{x}), f_2(\mathbf{x}), \dots, f_k(\mathbf{x}) \}$ subject to: $g_i(\mathbf{x}) \le 0$.
* **Side Note (Right):** Graph Neural Networks: $h_v^{(l+1)} = \sigma(\mathbf{W}^{(l)} \cdot \text{AGG}^{(l)}(\{h_u^{(l)} : u \in \mathcal{N}(v)\}))$.
#### Layer 4: Framework Integration Layer
* **Components:** Two rows of purple boxes representing specific technologies and their metrics.
* **Top Row (Message Brokers/Streaming Platforms):**
* **Apache Kafka:** $\lambda_{max} = 1.2 \times 10^6$ msg/sec
* **Apache Pulsar:** $\lambda_{max} = 3.5 \times 10^5$ msg/sec
* **RabbitMQ:** $\lambda_{max} = 4.5 \times 10^5$ msg/sec
* **NATS JetStream:** $L_{p95} = 15.3$ ms, $\mu = 8 \times 10^5$
* **Redis Streams:** $L_{p95} = 8.7$ ms, $\sigma^2 = 0.92$
* **Bottom Row (Event/Serverless Platforms):**
* **EventBridge:** $C(t) = \alpha \cdot N(t)$, elastic scaling
* **Pub/Sub:** $P(\text{delivery}) = 1 - \epsilon$, global distribution
* **Knative:** scale(0, $\infty$), container-native
#### Layer 5: Application Workload Layer
* **Components:** Three yellow boxes representing different types of application workloads.
* **W1: E-commerce:** $W_1 : \lambda \sim \mathcal{P}(\mu_1)$, ACID requirements
* **W2: IoT Telemetry:** $W_2 : \text{burst}(\alpha, \beta)$, fault-tolerant
* **W3: AI Inference:** $W_3 : \text{var}(T_{proc}) \le \delta$, variable latency
### Key Observations
1. **Mathematical Rigor:** Every layer is defined by specific mathematical formulations, moving from high-level optimization functions in Layer 1 to specific statistical distributions and constraints in Layer 5.
2. **Hybrid Approaches:** Layer 2 explicitly uses ensemble methods (ARIMA + Prophet + LSTM for prediction) and hybrid optimization techniques (PPO + Multi-objective GA for allocation).
3. **Feedback Mechanisms:** The dashed arrows clearly indicate a closed-loop system where the state of the adaptive layer (Layer 3) and predictive layer (Layer 2) continuously informs the top-level optimization algorithm (Layer 1).
4. **Specific Performance Metrics:** Layer 4 provides concrete performance metrics for different technologies, such as maximum throughput ($\lambda_{max}$) for Kafka, Pulsar, and RabbitMQ, and latency percentiles ($L_{p95}$) for NATS and Redis.
5. **Diverse Workload Modeling:** Layer 5 models different workloads with distinct mathematical characteristics: Poisson distribution for E-commerce, bursty behavior for IoT, and variance constraints for AI inference.
### Interpretation
The AIEO framework is a sophisticated, mathematically grounded approach to managing complex, event-driven systems. It functions as a closed-loop control system:
* **Layer 1 acts as the "brain,"** making high-level decisions to optimize the entire system's state based on a global loss function.
* **Layer 2 provides "foresight,"** predicting future workloads and determining optimal resource allocation policies using advanced machine learning (time series forecasting, reinforcement learning).
* **Layer 3 is the "action arm,"** implementing dynamic routing and resource management decisions, potentially using techniques like Q-learning and Graph Neural Networks to adapt to changing conditions.
* **Layer 4 represents the "infrastructure,"** the actual set of tools (Kafka, Knative, etc.) that execute the event handling, each with defined performance characteristics and capabilities.
* **Layer 5 is the "demand,"** the varied sources of events that the system must handle, each with unique requirements (ACID, fault tolerance, latency limits).
The framework demonstrates how theoretical mathematical models (optimization, RL, forecasting, statistics) can be directly applied to orchestrate real-world distributed technologies to meet diverse application requirements efficiently. The feedback loops ensure the system is self-optimizing and resilient to changes in workload or infrastructure state.
DECODING INTELLIGENCE...