# Technical Data Extraction: Comparative Performance Analysis of Translation Models
This document provides a detailed extraction of data from two side-by-side bar charts analyzing translation performance based on different loss objectives and preference data sources.
## 1. General Layout and Shared Metadata
* **Image Type:** Two grouped bar charts.
* **Y-Axis (Shared):**
* **Label:** `Avg. Ref-free Eval`
* **Scale:** Linear, ranging from 80 to 90.
* **Markers:** 80, 82, 84, 86, 88, 90.
* **Legend (Shared):**
* **Location:** Top-left of each chart.
* **Blue (Diagonal Hatching /):** `xx→en` (Translation from various languages to English).
* **Orange (Diagonal Hatching \):** `en→xx` (Translation from English to various languages).
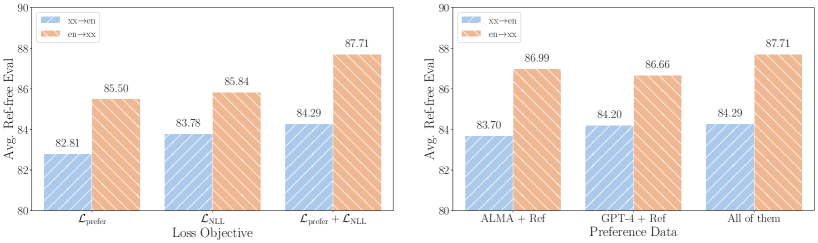
* **Visual Trend (General):** In every category across both charts, the `en→xx` (orange) series consistently outperforms the `xx→en` (blue) series.
---
## 2. Left Chart: Impact of Loss Objective
This chart evaluates performance based on three different mathematical loss functions used during training.
### Component Isolation: Loss Objective
* **X-Axis Label:** `Loss Objective`
* **Categories:** $\mathcal{L}_{\text{prefer}}$, $\mathcal{L}_{\text{NLL}}$, $\mathcal{L}_{\text{prefer}} + \mathcal{L}_{\text{NLL}}$
### Data Table: Loss Objective Performance
| Loss Objective | xx→en (Blue) | en→xx (Orange) |
| :--- | :---: | :---: |
| $\mathcal{L}_{\text{prefer}}$ | 82.81 | 85.50 |
| $\mathcal{L}_{\text{NLL}}$ | 83.78 | 85.84 |
| $\mathcal{L}_{\text{prefer}} + \mathcal{L}_{\text{NLL}}$ | 84.29 | 87.71 |
### Trend Analysis
* **xx→en (Blue):** Shows a steady upward trend as the objective moves from preference-only to combined loss ($+1.48$ point total increase).
* **en→xx (Orange):** Shows a significant jump when combining objectives, particularly between $\mathcal{L}_{\text{NLL}}$ and the combined $\mathcal{L}_{\text{prefer}} + \mathcal{L}_{\text{NLL}}$ ($+2.21$ point total increase).
* **Conclusion:** The combination of both loss functions yields the highest performance for both translation directions.
---
## 3. Right Chart: Impact of Preference Data Source
This chart evaluates performance based on the source of the data used to determine preferences.
### Component Isolation: Preference Data
* **X-Axis Label:** `Preference Data`
* **Categories:** `ALMA + Ref`, `GPT-4 + Ref`, `All of them`
### Data Table: Preference Data Performance
| Preference Data | xx→en (Blue) | en→xx (Orange) |
| :--- | :---: | :---: |
| ALMA + Ref | 83.70 | 86.99 |
| GPT-4 + Ref | 84.20 | 86.66 |
| All of them | 84.29 | 87.71 |
### Trend Analysis
* **xx→en (Blue):** Shows incremental improvement as more data sources are added, peaking at "All of them" (84.29).
* **en→xx (Orange):** Interestingly, `ALMA + Ref` (86.99) performs slightly better than `GPT-4 + Ref` (86.66), but the combination of all sources ("All of them") results in the highest overall score (87.71).
* **Conclusion:** Utilizing all available preference data sources provides the most robust performance across both metrics.
---
## 4. Summary of Key Findings
* **Highest Performance:** The peak performance for both charts is achieved with the combination of $\mathcal{L}_{\text{prefer}} + \mathcal{L}_{\text{NLL}}$ using "All of them" preference data, reaching **84.29** for `xx→en` and **87.71** for `en→xx`.
* **Directional Bias:** English-to-other-languages (`en→xx`) consistently scores approximately 2.5 to 3.5 points higher than other-languages-to-English (`xx→en`) across all tested variables.