\n
## Diagram: Lattice Point Illustration
### Overview
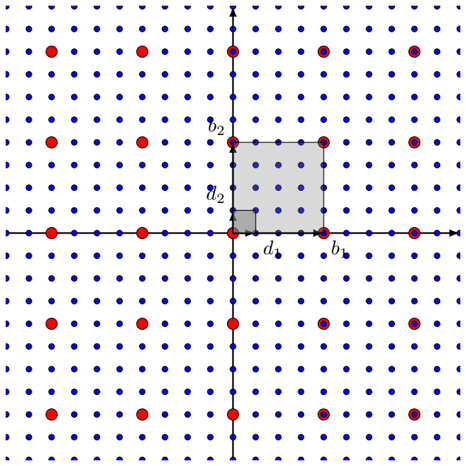
The image depicts a two-dimensional lattice of points, with some points highlighted in red. A shaded square is centered on the origin, and several points are labeled with letters: `b1`, `b2`, `d1`, `d2`. The diagram appears to illustrate a concept related to lattice points, possibly in the context of number theory or geometry.
### Components/Axes
The diagram consists of:
* A grid of blue points forming a lattice.
* Red points scattered throughout the lattice.
* A shaded square centered at the origin (0,0).
* Horizontal and vertical axes representing the coordinate system.
* Labels: `b1`, `b2`, `d1`, `d2` placed near specific points.
The axes are not explicitly labeled with numerical scales, but they clearly define a Cartesian coordinate system.
### Detailed Analysis / Content Details
The diagram shows a square centered at the origin. The vertices of the square are located on the lattice points. The labeled points are as follows:
* `b1`: Located on the positive x-axis, approximately (3,0).
* `b2`: Located on the positive y-axis, approximately (0,3).
* `d1`: Located on the negative x-axis, approximately (-3,0).
* `d2`: Located on the negative y-axis, approximately (0,-3).
The red points are not uniformly distributed. They appear to be concentrated along certain lines or regions within the lattice. There are approximately 20 red points visible. The red points do not seem to have a clear pattern or relationship to the labeled points or the shaded square.
### Key Observations
* The labeled points `b1`, `b2`, `d1`, and `d2` define the boundaries of a square with sides parallel to the coordinate axes.
* The shaded square appears to represent a region of interest within the lattice.
* The distribution of red points is non-uniform, suggesting a specific criterion for their selection.
* The diagram does not provide any numerical data or quantitative measurements.
### Interpretation
The diagram likely illustrates a concept related to lattice points and their properties. The shaded square might represent a fundamental cell or a region of interest in a lattice-based system. The red points could represent points satisfying a specific condition or belonging to a particular set within the lattice. The labels `b1`, `b2`, `d1`, and `d2` might denote boundary points or reference points for a geometric construction.
Without additional context, it is difficult to determine the precise meaning of the diagram. However, it suggests a visual representation of a mathematical or geometric concept involving lattice points, squares, and potentially a selection criterion for points within the lattice. The diagram could be used to illustrate concepts in number theory, cryptography, or signal processing, where lattice structures are commonly employed. The non-uniform distribution of red points hints at a specific rule or condition governing their placement.