## Mathematical Diagram: Lattice with Basis Vectors
### Overview
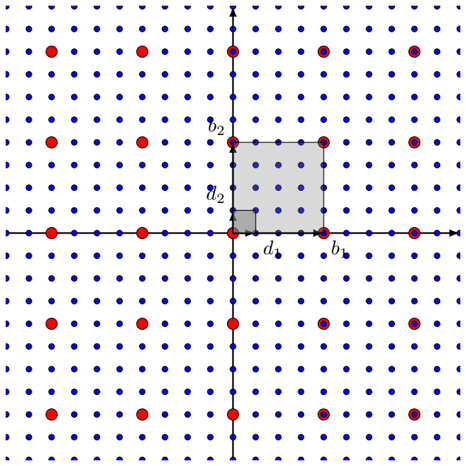
The image is a technical mathematical diagram illustrating a two-dimensional lattice structure. It features a fine grid of blue dots, a coarser grid of red dots, two sets of basis vectors, and a shaded parallelogram region. The diagram is likely used to explain concepts in lattice theory, crystallography, or vector algebra, showing the relationship between a primary lattice (blue) and a sublattice (red).
### Components/Axes
1. **Coordinate System:** A standard Cartesian coordinate system is implied by the perpendicular axes. The horizontal axis (x-axis) and vertical axis (y-axis) are drawn as black lines with arrowheads at their positive ends (right and top, respectively). They intersect at the origin (0,0).
2. **Lattice Points (Blue):** A dense, uniform square grid of small blue dots fills the entire image. The spacing between adjacent blue dots along the axes appears to be 1 unit.
3. **Lattice Points (Red):** Larger red dots are placed at specific intersections of the blue grid. They form a coarser square lattice. The red dots are located at coordinates where both x and y are multiples of 4 (e.g., (0,0), (4,0), (0,4), (4,4), (-4,0), etc.).
4. **Vectors and Labels:**
* **Vector `b₁`:** A black arrow originating from the origin (0,0) and pointing along the positive x-axis. Its tip ends at the first red dot to the right of the origin, at coordinate (4,0). The label `b₁` is placed just below the arrowhead.
* **Vector `b₂`:** A black arrow originating from the origin (0,0) and pointing along the positive y-axis. Its tip ends at the first red dot above the origin, at coordinate (0,4). The label `b₂` is placed just to the left of the arrowhead.
* **Vector `d₁`:** A shorter black arrow originating from the origin (0,0) and pointing along the positive x-axis. Its tip ends at the first blue dot to the right of the origin, at coordinate (1,0). The label `d₁` is placed just below the arrowhead.
* **Vector `d₂`:** A shorter black arrow originating from the origin (0,0) and pointing along the positive y-axis. Its tip ends at the first blue dot above the origin, at coordinate (0,1). The label `d₂` is placed just to the left of the arrowhead.
5. **Shaded Region:** A light gray, semi-transparent parallelogram is drawn. Its vertices are at the origin (0,0), the tip of `d₁` (1,0), the tip of `b₂` (0,4), and the point (1,4). This region is bounded by the vectors `d₁` and `b₂`.
### Detailed Analysis
* **Lattice Relationship:** The red lattice is a sublattice of the blue lattice. Every red point coincides with a blue point, but not every blue point is red. The red lattice has a basis of vectors `b₁` and `b₂`, which are four times longer than the basis vectors `d₁` and `d₂` of the blue lattice.
* **Vector Definitions:**
* `b₁ = 4 * d₁`
* `b₂ = 4 * d₂`
* **Shaded Parallelogram:** This area represents a fundamental domain or unit cell for the red lattice, defined by the vectors `d₁` and `b₂`. It contains exactly one complete set of the finer blue lattice points within its boundaries (specifically, the points at (0,0), (1,0), (0,1), (1,1), (0,2), (1,2), (0,3), (1,3), (0,4), and (1,4) – though the top edge is shared with the next cell).
### Key Observations
1. **Scale Difference:** The primary visual distinction is the scale difference between the two lattices. The red lattice points are spaced 4 units apart, while the blue lattice points are spaced 1 unit apart.
2. **Basis Vector Alignment:** Both sets of basis vectors (`b₁`, `b₂` and `d₁`, `d₂`) are aligned with the coordinate axes, indicating an orthogonal lattice structure.
3. **Visual Emphasis:** The shaded region draws attention to the relationship between the two lattices, highlighting how a larger unit cell of the red lattice encompasses multiple unit cells of the blue lattice.
4. **Symmetry:** The diagram exhibits four-fold rotational symmetry about the origin.
### Interpretation
This diagram visually demonstrates the concept of a **sublattice** and **basis scaling** in a 2D integer lattice (Z²). The blue dots represent the standard integer lattice. The red dots represent a sublattice generated by scaling the basis vectors by a factor of 4.
The shaded parallelogram is a **fundamental parallelogram** for the red lattice when using the mixed basis `{d₁, b₂}`. Its area (4 square units) is equal to the determinant of the matrix formed by these vectors, which is also the index of the red sublattice within the blue lattice (i.e., there are 4 blue lattice points per red lattice point on average).
The diagram is a foundational tool for understanding topics such as:
* **Crystallography:** Showing how a crystal structure (red) can be described as a sublattice of a simpler, higher-symmetry lattice (blue).
* **Number Theory:** Illustrating the structure of integer solutions to linear equations.
* **Computer Science:** Relevant to lattice-based cryptography and algorithms that operate on grid structures.
The clear, labeled vectors and the contrasting dot colors make it an effective educational figure for explaining how different bases can describe the same or related geometric structures.