## Radar Charts: Neuro-Symbolic Performance Metrics
### Overview
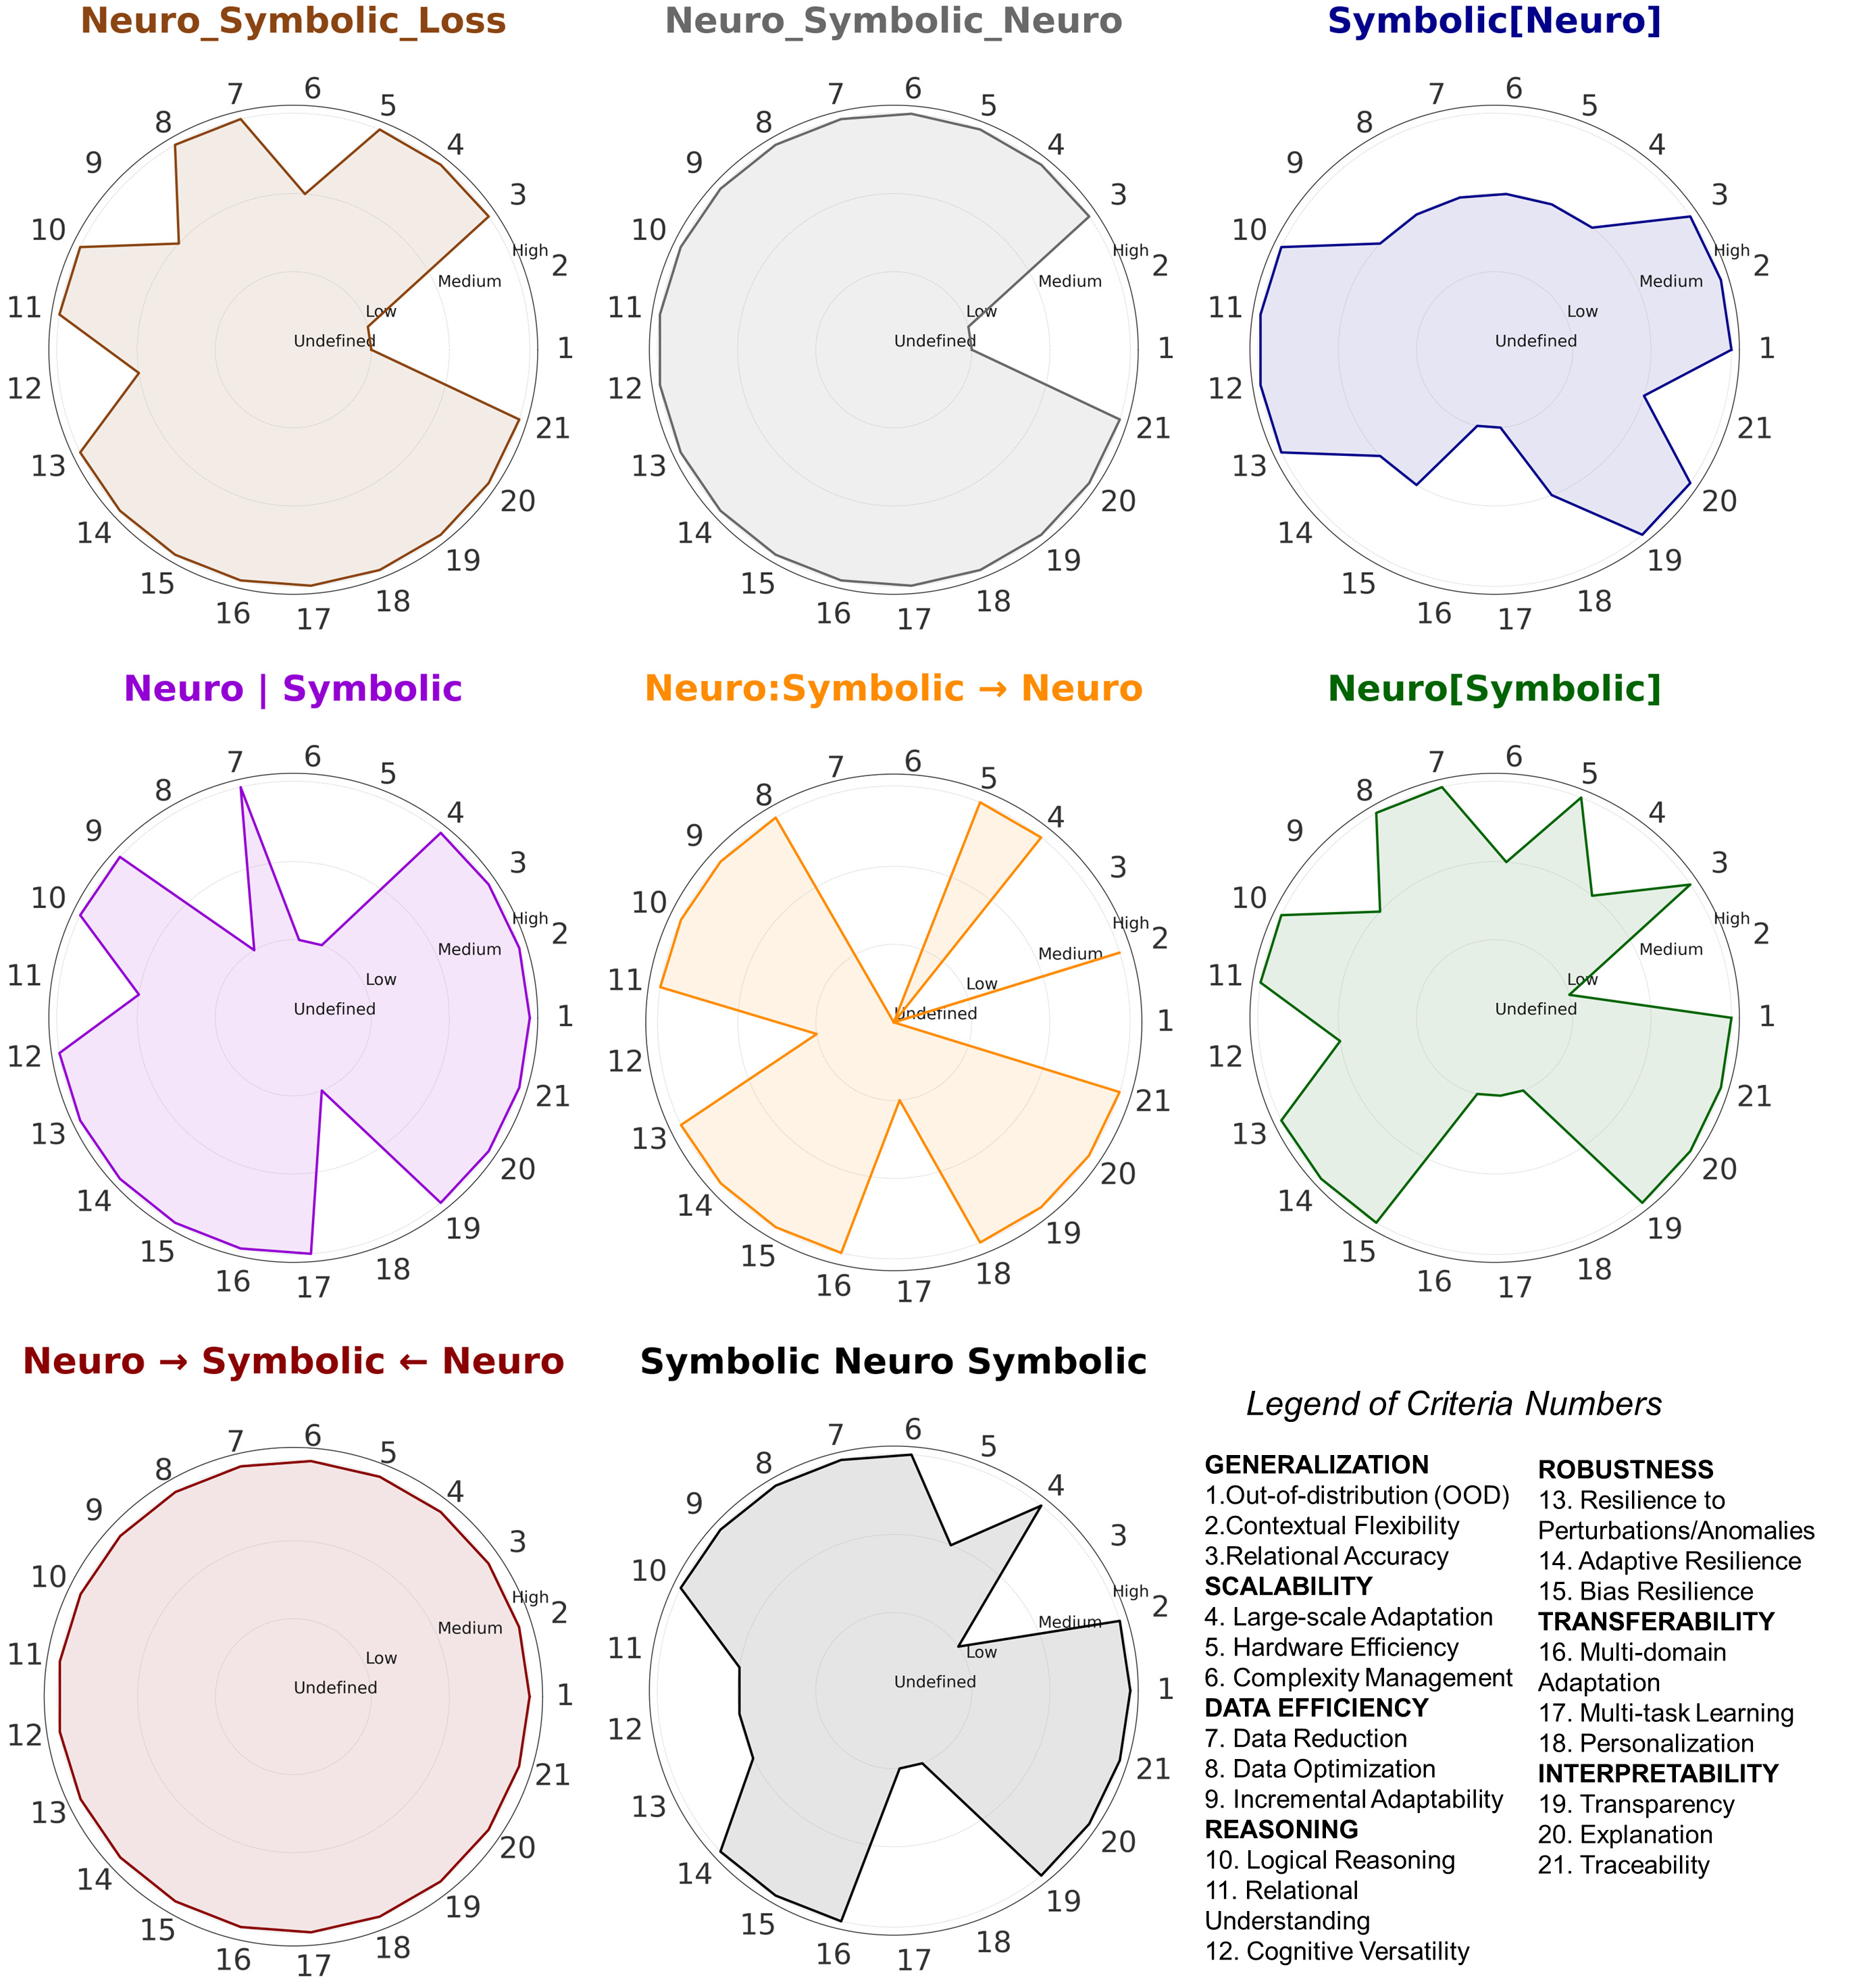
The image presents a collection of radar charts, each visualizing the performance of different Neuro-Symbolic architectures across a set of 21 criteria. The criteria are arranged radially, and the charts depict the relative strengths and weaknesses of each architecture. A legend provides the definitions for each criterion number.
### Components/Axes
* **Chart Titles:** Each radar chart has a title indicating the specific architecture being evaluated:
* Neuro\_Symbolic\_Loss (Top-Left)
* Neuro\_Symbolic\_Neuro (Top-Center)
* Symbolic[Neuro] (Top-Right)
* Neuro | Symbolic (Middle-Left)
* Neuro:Symbolic -> Neuro (Middle-Center)
* Neuro[Symbolic] (Middle-Right)
* Neuro -> Symbolic <- Neuro (Bottom-Left)
* Symbolic Neuro Symbolic (Bottom-Right)
* **Radial Axes:** Each axis represents a specific criterion, numbered from 1 to 21, arranged in a clockwise direction.
* **Concentric Circles:** Three concentric circles are labeled "Low", "Medium", and "High", indicating the relative performance level for each criterion. The center is labeled "Undefined".
* **Data Series:** Each chart contains a single data series, represented by a colored line that connects the performance levels for each criterion. The area enclosed by the line is filled with a translucent version of the line's color.
* **Legend:** Located at the bottom-right of the image, the legend maps the criterion numbers to their corresponding descriptions.
### Detailed Analysis
**Legend of Criteria Numbers:**
* **GENERALIZATION**
* 1: Out-of-distribution (OOD)
* 2: Contextual Flexibility
* 3: Relational Accuracy
* **SCALABILITY**
* 4: Large-scale Adaptation
* 5: Hardware Efficiency
* 6: Complexity Management
* **DATA EFFICIENCY**
* 7: Data Reduction
* 8: Data Optimization
* 9: Incremental Adaptability
* **REASONING**
* 10: Logical Reasoning
* 11: Relational Understanding
* 12: Cognitive Versatility
* **ROBUSTNESS**
* 13: Resilience to Perturbations/Anomalies
* 14: Adaptive Resilience
* 15: Bias Resilience
* **TRANSFERABILITY**
* 16: Multi-domain Adaptation
* 17: Multi-task Learning
* 18: Personalization
* **INTERPRETABILITY**
* 19: Transparency
* 20: Explanation
* 21: Traceability
**Chart-Specific Data:**
* **Neuro\_Symbolic\_Loss (Brown):**
* High values for criteria 4, 5, 8, 9, 10, 11, 12, 13, 14, 15, 16, 17, 18, 19, 20, 21.
* Low values for criteria 1, 2, 3, 6, 7.
* **Neuro\_Symbolic\_Neuro (Gray):**
* High values for criteria 4, 5, 6, 7, 8, 9, 10, 11, 12, 13, 14, 15, 16, 17, 18, 19, 20, 21.
* Low values for criteria 1, 2, 3.
* **Symbolic[Neuro] (Dark Blue):**
* High values for criteria 6, 7, 8, 9, 10, 11, 12, 13, 14, 15, 16, 17, 18, 19, 20, 21.
* Low values for criteria 1, 2, 3, 4, 5.
* **Neuro | Symbolic (Purple):**
* High values for criteria 4, 7, 10, 13, 16, 17, 18, 19, 20, 21.
* Low values for criteria 1, 2, 3, 5, 6, 8, 9, 11, 12, 14, 15.
* **Neuro:Symbolic -> Neuro (Orange):**
* High values for criteria 4, 5, 8, 9, 10, 11, 12, 13, 14, 15, 16, 17, 18, 19, 20, 21.
* Low values for criteria 1, 2, 3, 6, 7.
* **Neuro[Symbolic] (Green):**
* High values for criteria 4, 5, 6, 7, 8, 9, 10, 11, 12, 13, 14, 15, 16, 17, 18, 19, 20, 21.
* Low values for criteria 1, 2, 3.
* **Neuro -> Symbolic <- Neuro (Red):**
* High values for criteria 4, 5, 6, 7, 8, 9, 10, 11, 12, 13, 14, 15, 16, 17, 18, 19, 20, 21.
* Low values for criteria 1, 2, 3.
* **Symbolic Neuro Symbolic (Black):**
* High values for criteria 4, 5, 6, 7, 8, 9, 10, 11, 12, 13, 14, 15, 16, 17, 18, 19, 20, 21.
* Low values for criteria 1, 2, 3.
### Key Observations
* All architectures show relatively low performance in Out-of-distribution (OOD), Contextual Flexibility, and Relational Accuracy (criteria 1, 2, and 3).
* Most architectures demonstrate high performance in Traceability (criterion 21).
* The "Neuro | Symbolic" architecture (purple) exhibits a distinct performance profile compared to the others, with lower scores across a broader range of criteria.
### Interpretation
The radar charts provide a visual comparison of different Neuro-Symbolic architectures, highlighting their strengths and weaknesses across various performance criteria. The consistent low scores for criteria 1, 2, and 3 suggest a common challenge in these areas for Neuro-Symbolic systems. The "Neuro | Symbolic" architecture's unique profile indicates a different design or optimization strategy that may prioritize certain aspects over others. The high performance in Traceability (criterion 21) across most architectures suggests a focus on explainability and debugging capabilities. The data suggests that while Neuro-Symbolic systems are strong in areas like scalability and interpretability, further research is needed to improve their generalization capabilities and contextual understanding.