\n
## Venn Diagram: Overlap of Unigram Sets
### Overview
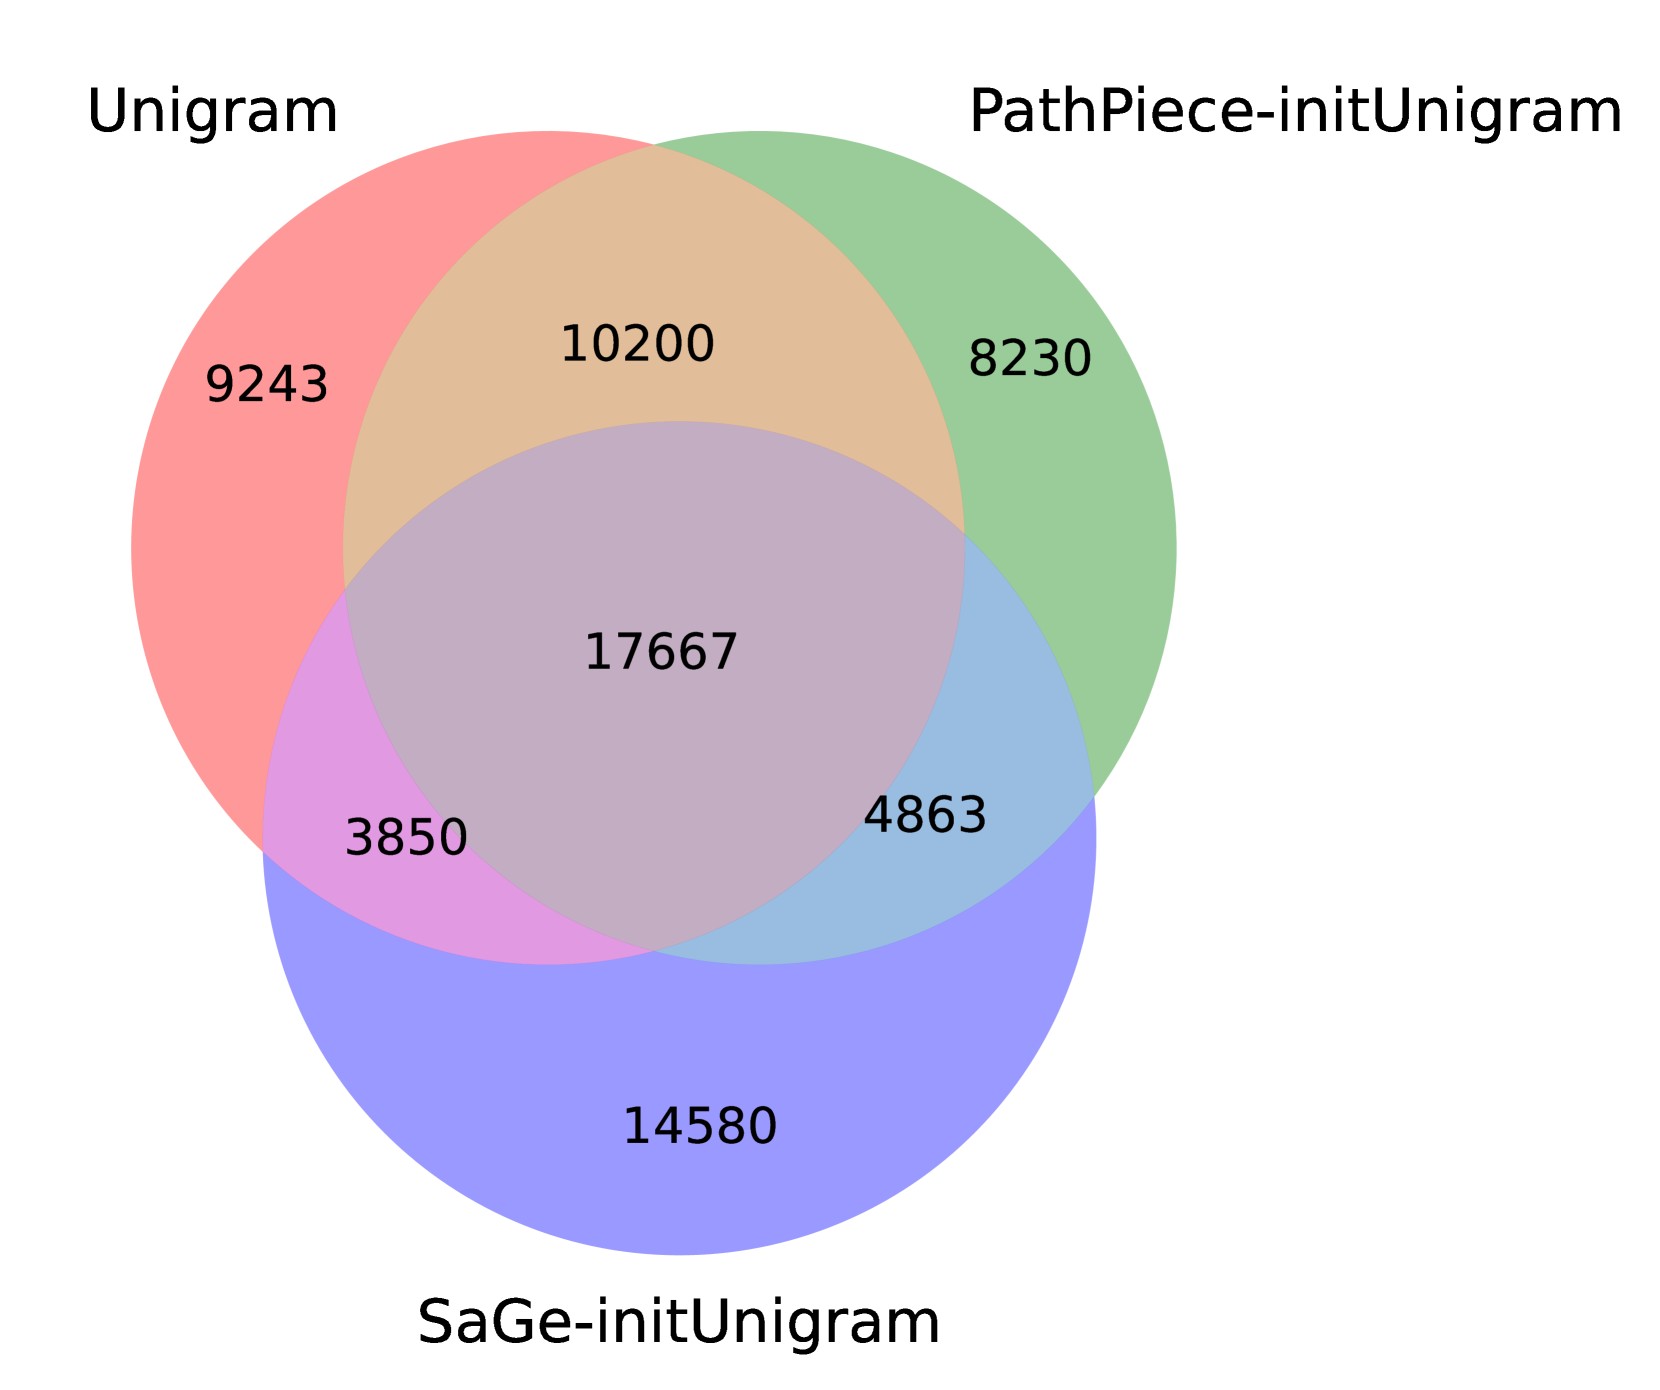
This image is a Venn diagram illustrating the overlap between three sets: Unigram, PathPiece-initUnigram, and SaGe-initUnigram. The diagram uses three overlapping circles, with numerical values indicating the number of elements in each section of the diagram.
### Components/Axes
The diagram consists of three labeled circles:
* **Unigram** (represented by a red circle, positioned top-left)
* **PathPiece-initUnigram** (represented by a green circle, positioned top-right)
* **SaGe-initUnigram** (represented by a blue circle, positioned bottom-center)
The overlapping regions contain numerical values representing the intersection of the respective sets. There are no explicit axes or scales.
### Detailed Analysis or Content Details
The following values are present in the Venn diagram:
* **Unigram only:** 9243
* **PathPiece-initUnigram only:** 8230
* **SaGe-initUnigram only:** 14580
* **Unigram and PathPiece-initUnigram overlap:** 10200
* **Unigram and SaGe-initUnigram overlap:** 3850
* **PathPiece-initUnigram and SaGe-initUnigram overlap:** 4863
* **Unigram, PathPiece-initUnigram, and SaGe-initUnigram overlap:** 17667
### Key Observations
The largest overlap occurs between all three sets (17667). The set "SaGe-initUnigram" has the largest unique element count (14580). The overlap between "Unigram" and "PathPiece-initUnigram" is also substantial (10200). The overlap between "Unigram" and "SaGe-initUnigram" is the smallest (3850).
### Interpretation
This Venn diagram likely represents the commonality and uniqueness of unigrams identified by three different methods or sources: Unigram, PathPiece-initUnigram, and SaGe-initUnigram. The large overlap between all three sets (17667) suggests a core set of unigrams that are consistently identified across all methods. The unique counts for each set indicate the additional unigrams identified specifically by that method.
The diagram suggests that while there is a significant common ground, each method also captures unigrams that are not identified by the others. This could be due to differences in the data sources, the algorithms used, or the parameters applied. The relatively small overlap between Unigram and SaGe-initUnigram (3850) might indicate that these two methods have the most distinct approaches to unigram identification.
The diagram provides a visual representation of the relationships between these three sets of unigrams, allowing for a quick assessment of their commonalities and differences. It could be used to inform decisions about which methods to use for unigram identification, or to combine the results of multiple methods to create a more comprehensive set of unigrams.