## Venn Diagram: Overlap Analysis of Unigram, PathPiece-initUnigram, and SaGe-initUnigram
### Overview
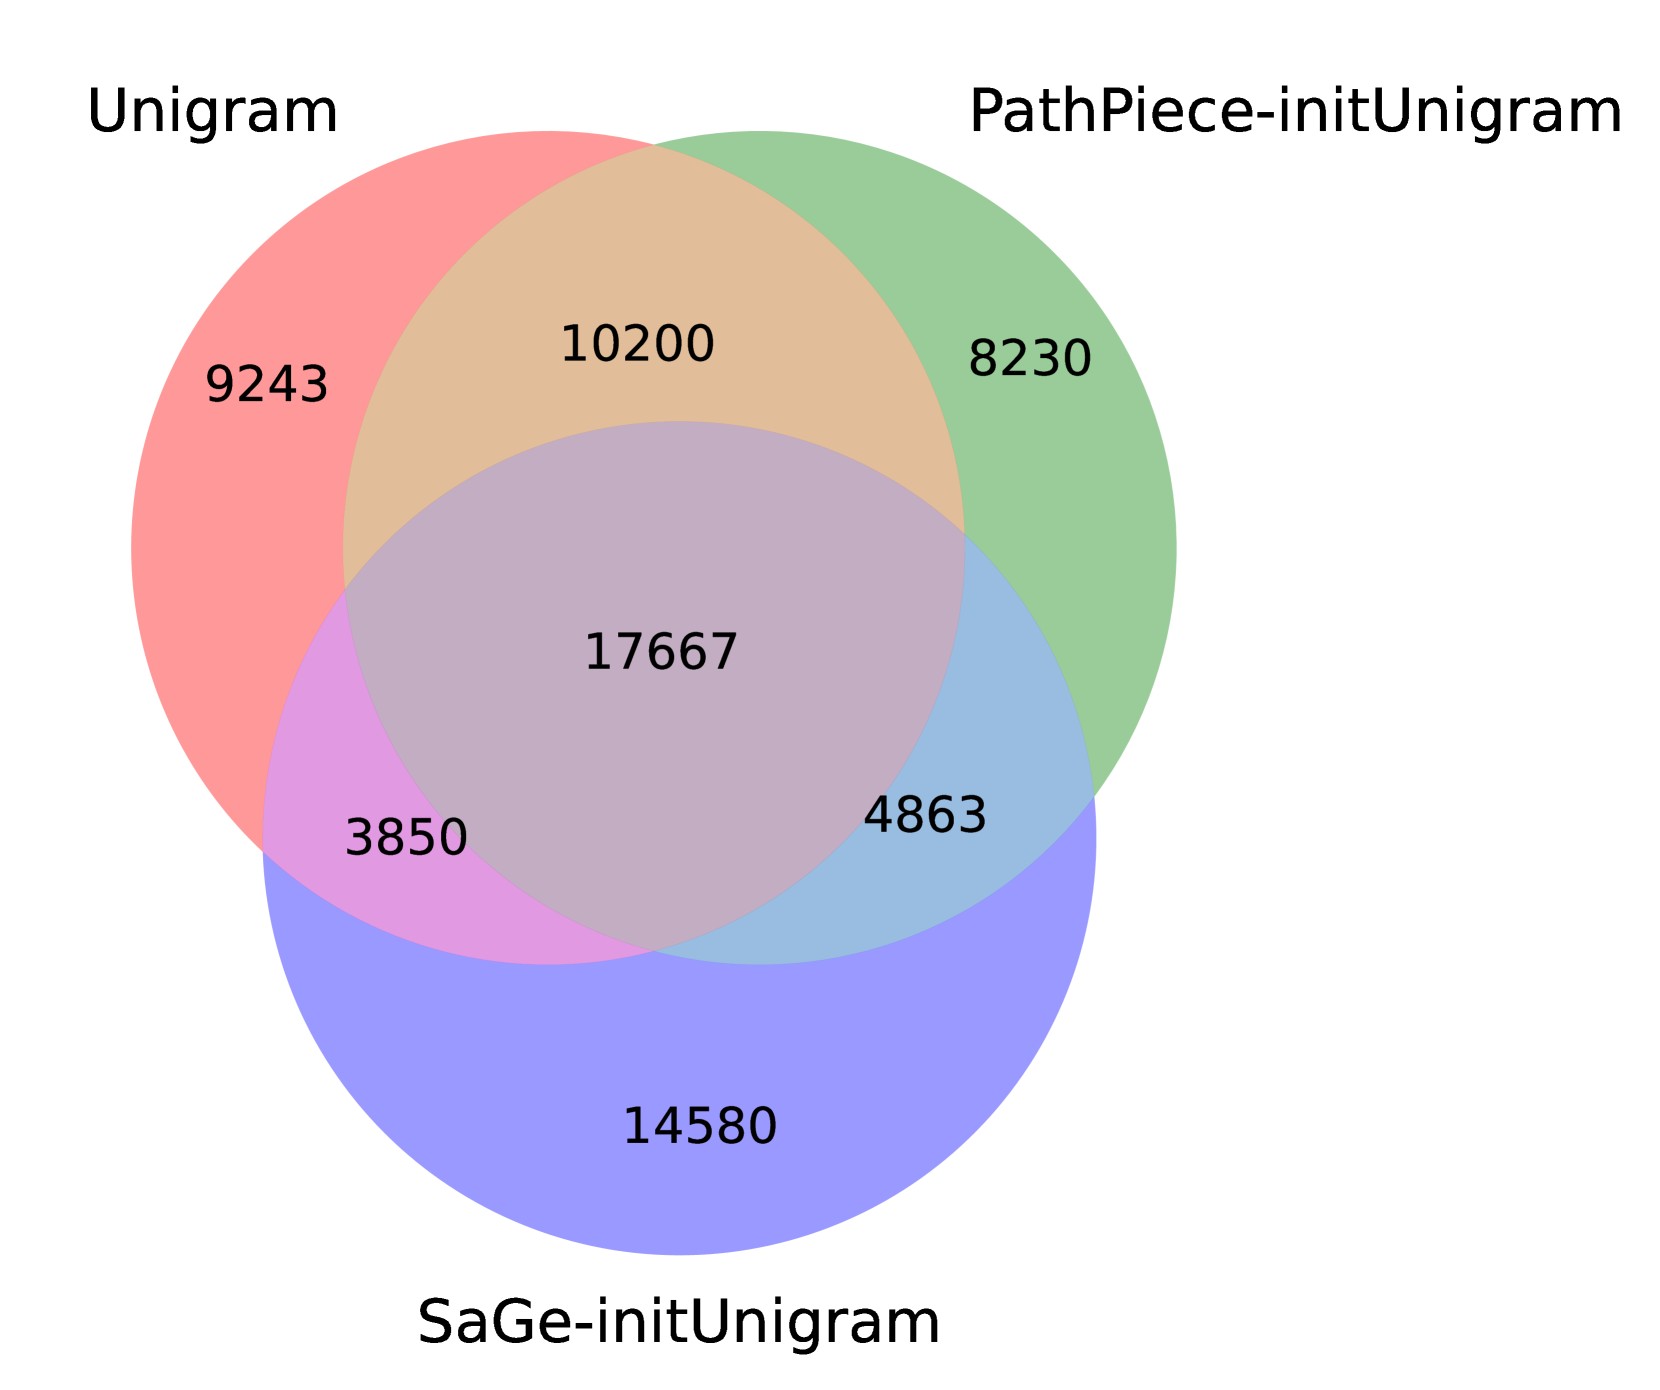
The image depicts a three-circle Venn diagram comparing three sets: **Unigram** (red), **PathPiece-initUnigram** (green), and **SaGe-initUnigram** (blue). Numerical values are embedded in each segment, representing counts of shared or unique elements. The diagram emphasizes overlaps, with the central intersection (all three sets) being the largest segment.
---
### Components/Axes
- **Labels**:
- Top-left: **Unigram** (red circle)
- Top-right: **PathPiece-initUnigram** (green circle)
- Bottom: **SaGe-initUnigram** (blue circle)
- **Legend**:
- Red = Unigram
- Green = PathPiece-initUnigram
- Blue = SaGe-initUnigram
- Overlapping regions use blended colors (e.g., purple for red+blue).
- **Placement**:
- Legend is positioned at the top, aligned with the circles.
- Numerical values are centered within each segment.
---
### Detailed Analysis
#### Unique Segments
- **Unigram-only (red)**: 9,243
- **PathPiece-initUnigram-only (green)**: 8,230
- **SaGe-initUnigram-only (blue)**: 14,580
#### Pairwise Overlaps
- **Unigram ∩ PathPiece-initUnigram (red+green)**: 10,200
- **Unigram ∩ SaGe-initUnigram (red+blue)**: 3,850
- **PathPiece-initUnigram ∩ SaGe-initUnigram (green+blue)**: 4,863
#### Triple Overlap
- **Unigram ∩ PathPiece-initUnigram ∩ SaGe-initUnigram (center)**: 17,667
---
### Key Observations
1. **Dominant Triple Overlap**: The central intersection (17,667) is the largest segment, indicating significant shared elements across all three sets.
2. **SaGe-initUnigram Dominance**: The blue circle has the largest unique segment (14,580), suggesting SaGe-initUnigram contributes the most unique elements.
3. **Strongest Pairwise Overlap**: Unigram and PathPiece-initUnigram share the most elements (10,200), followed by PathPiece-initUnigram and SaGe-initUnigram (4,863).
4. **Smaller Overlaps**: Unigram and SaGe-initUnigram have the smallest pairwise overlap (3,850).
---
### Interpretation
- **Shared vs. Unique Contributions**:
- The central overlap (17,667) implies a high degree of commonality among all three methods, possibly indicating shared foundational elements or methodologies.
- SaGe-initUnigram’s large unique segment (14,580) suggests it introduces novel elements not present in the other sets.
- **Methodological Relationships**:
- The strong Unigram-PathPiece overlap (10,200) may reflect shared initialization strategies or data dependencies.
- The smaller Unigram-SaGe overlap (3,850) could indicate divergent approaches in handling unigrams.
- **Potential Implications**:
- The diagram highlights trade-offs between specialization (unique elements) and generalization (shared elements).
- The central overlap might represent a core functionality or dataset common to all three approaches.
---
### Spatial Grounding & Validation
- **Legend Accuracy**: Colors match segments exactly (e.g., red for Unigram, green for PathPiece-initUnigram).
- **Value Consistency**: All numerical values align with their respective regions (e.g., 17,667 in the center).
- **Trend Verification**: The central segment’s size visually dominates, confirming its numerical prominence.
---
### Conclusion
This Venn diagram illustrates the interplay between three unigram-based methods, emphasizing their shared and unique components. The data suggests SaGe-initUnigram introduces the most unique elements, while the central overlap highlights critical shared functionality. The pairwise overlaps reveal varying degrees of interdependence between the methods.