## Line Chart: Performance vs. Training Tokens
### Overview
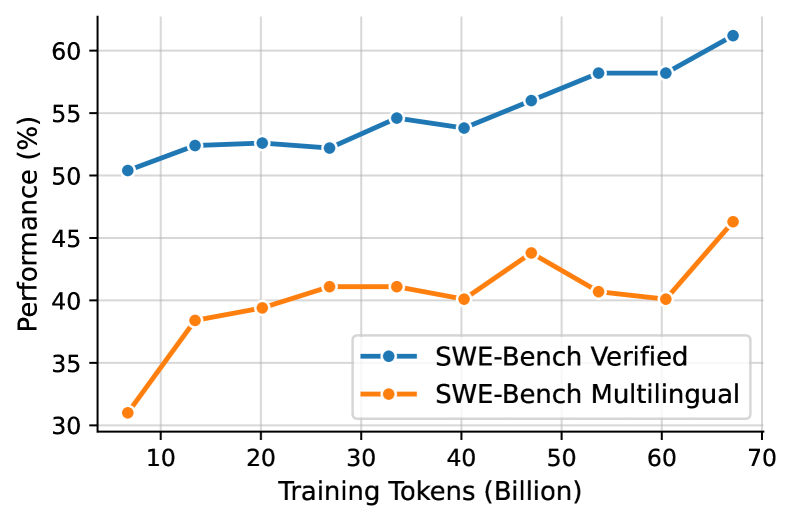
The image is a line chart comparing the performance of two models, "SWE-Bench Verified" and "SWE-Bench Multilingual," against the number of training tokens (in billions). The chart shows how performance (in percentage) changes as the models are trained with more data.
### Components/Axes
* **X-axis:** Training Tokens (Billion). Scale ranges from approximately 5 to 70, with markers at 10, 20, 30, 40, 50, 60, and 70.
* **Y-axis:** Performance (%). Scale ranges from 30 to 60, with markers at 30, 35, 40, 45, 50, 55, and 60.
* **Legend:** Located in the bottom-right of the chart.
* Blue line: SWE-Bench Verified
* Orange line: SWE-Bench Multilingual
### Detailed Analysis
* **SWE-Bench Verified (Blue Line):**
* Trend: Generally slopes upward, indicating improved performance with more training tokens.
* Data Points:
* At 5 Billion Tokens: ~50.5%
* At 10 Billion Tokens: ~52.5%
* At 20 Billion Tokens: ~52.7%
* At 30 Billion Tokens: ~52.3%
* At 40 Billion Tokens: ~54.2%
* At 50 Billion Tokens: ~56.0%
* At 60 Billion Tokens: ~58.5%
* At 65 Billion Tokens: ~58.5%
* At 70 Billion Tokens: ~61.2%
* **SWE-Bench Multilingual (Orange Line):**
* Trend: Initially slopes upward, then fluctuates, but generally increases overall.
* Data Points:
* At 5 Billion Tokens: ~31.0%
* At 10 Billion Tokens: ~38.5%
* At 20 Billion Tokens: ~39.5%
* At 30 Billion Tokens: ~41.2%
* At 40 Billion Tokens: ~40.2%
* At 50 Billion Tokens: ~44.0%
* At 60 Billion Tokens: ~40.5%
* At 65 Billion Tokens: ~40.0%
* At 70 Billion Tokens: ~46.5%
### Key Observations
* The "SWE-Bench Verified" model consistently outperforms the "SWE-Bench Multilingual" model across all training token values.
* Both models show improvement in performance as the number of training tokens increases, but the "SWE-Bench Verified" model demonstrates a more stable and consistent upward trend.
* The "SWE-Bench Multilingual" model shows more fluctuation in performance, particularly between 40 and 65 billion training tokens.
### Interpretation
The data suggests that the "SWE-Bench Verified" model is more effective or better suited for the task being measured, as it consistently achieves higher performance levels than the "SWE-Bench Multilingual" model. The upward trends indicate that both models benefit from increased training data, but the "SWE-Bench Verified" model appears to leverage the data more efficiently. The fluctuations in the "SWE-Bench Multilingual" model's performance could indicate sensitivity to specific data subsets or potential overfitting issues. The performance gap between the two models widens as the number of training tokens increases, suggesting that the "SWE-Bench Verified" model scales better with more data.